
Submarine pipeline explosions
Roger Alexander
Corrosion Control Technologist
Evidence
This document is for the attention of scientists, schollars, corrosion engineers, financial controllers, CEOs, government officials and the public.
All pictures and video clips in this document are the intelectual property of CPN Blockchain.
These pictures, videos and diagrams support the narative in this document according to the scientific method.
1.
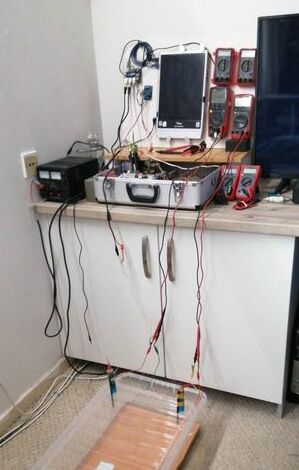
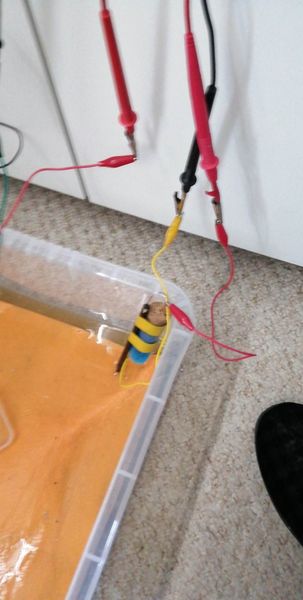
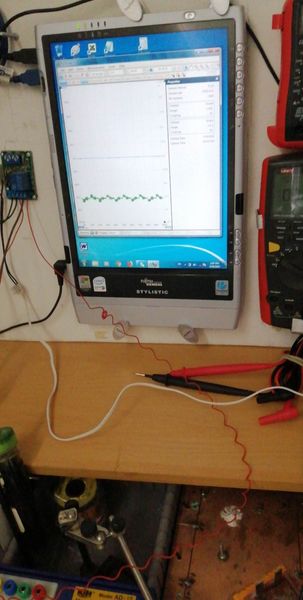
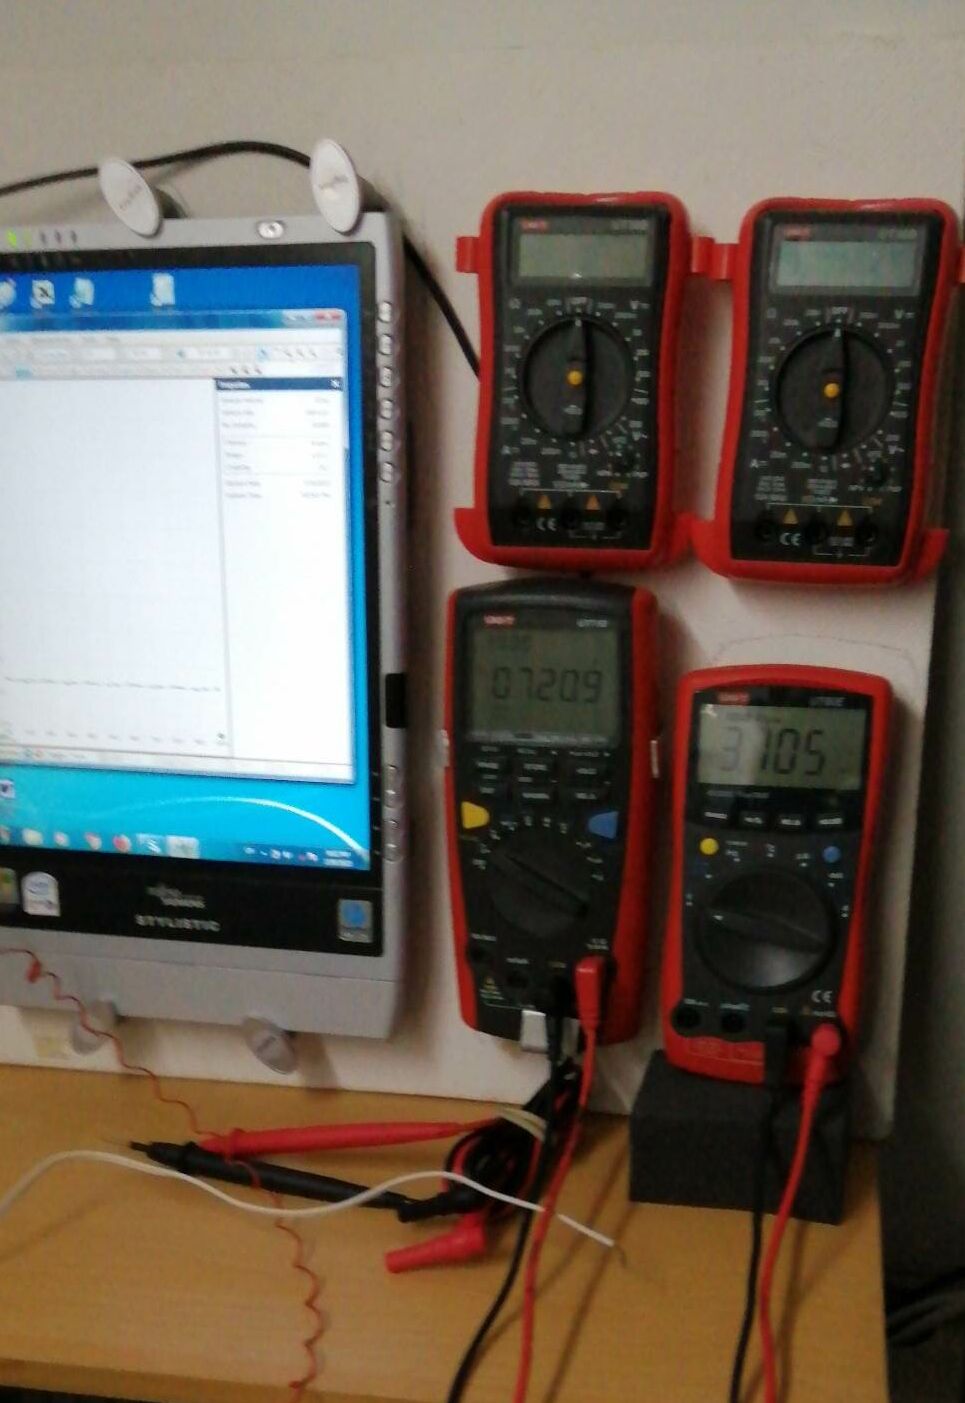
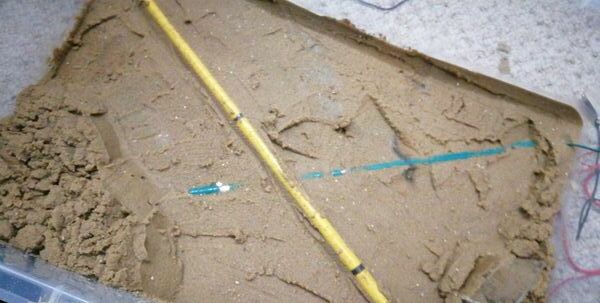
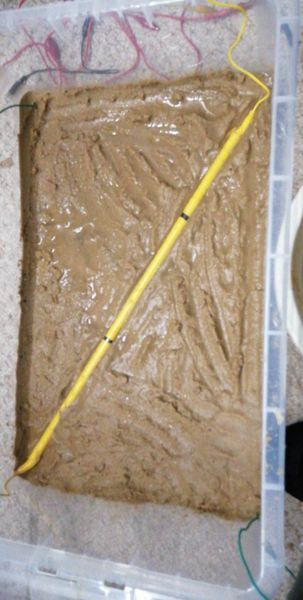
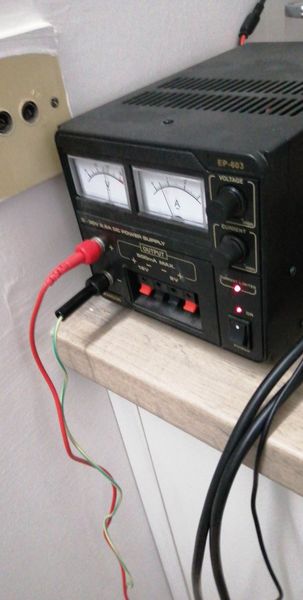
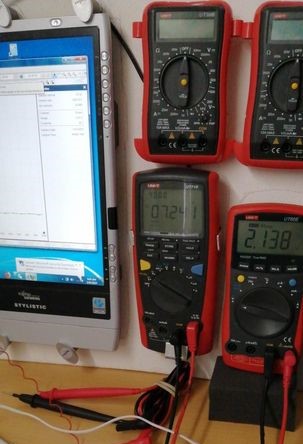
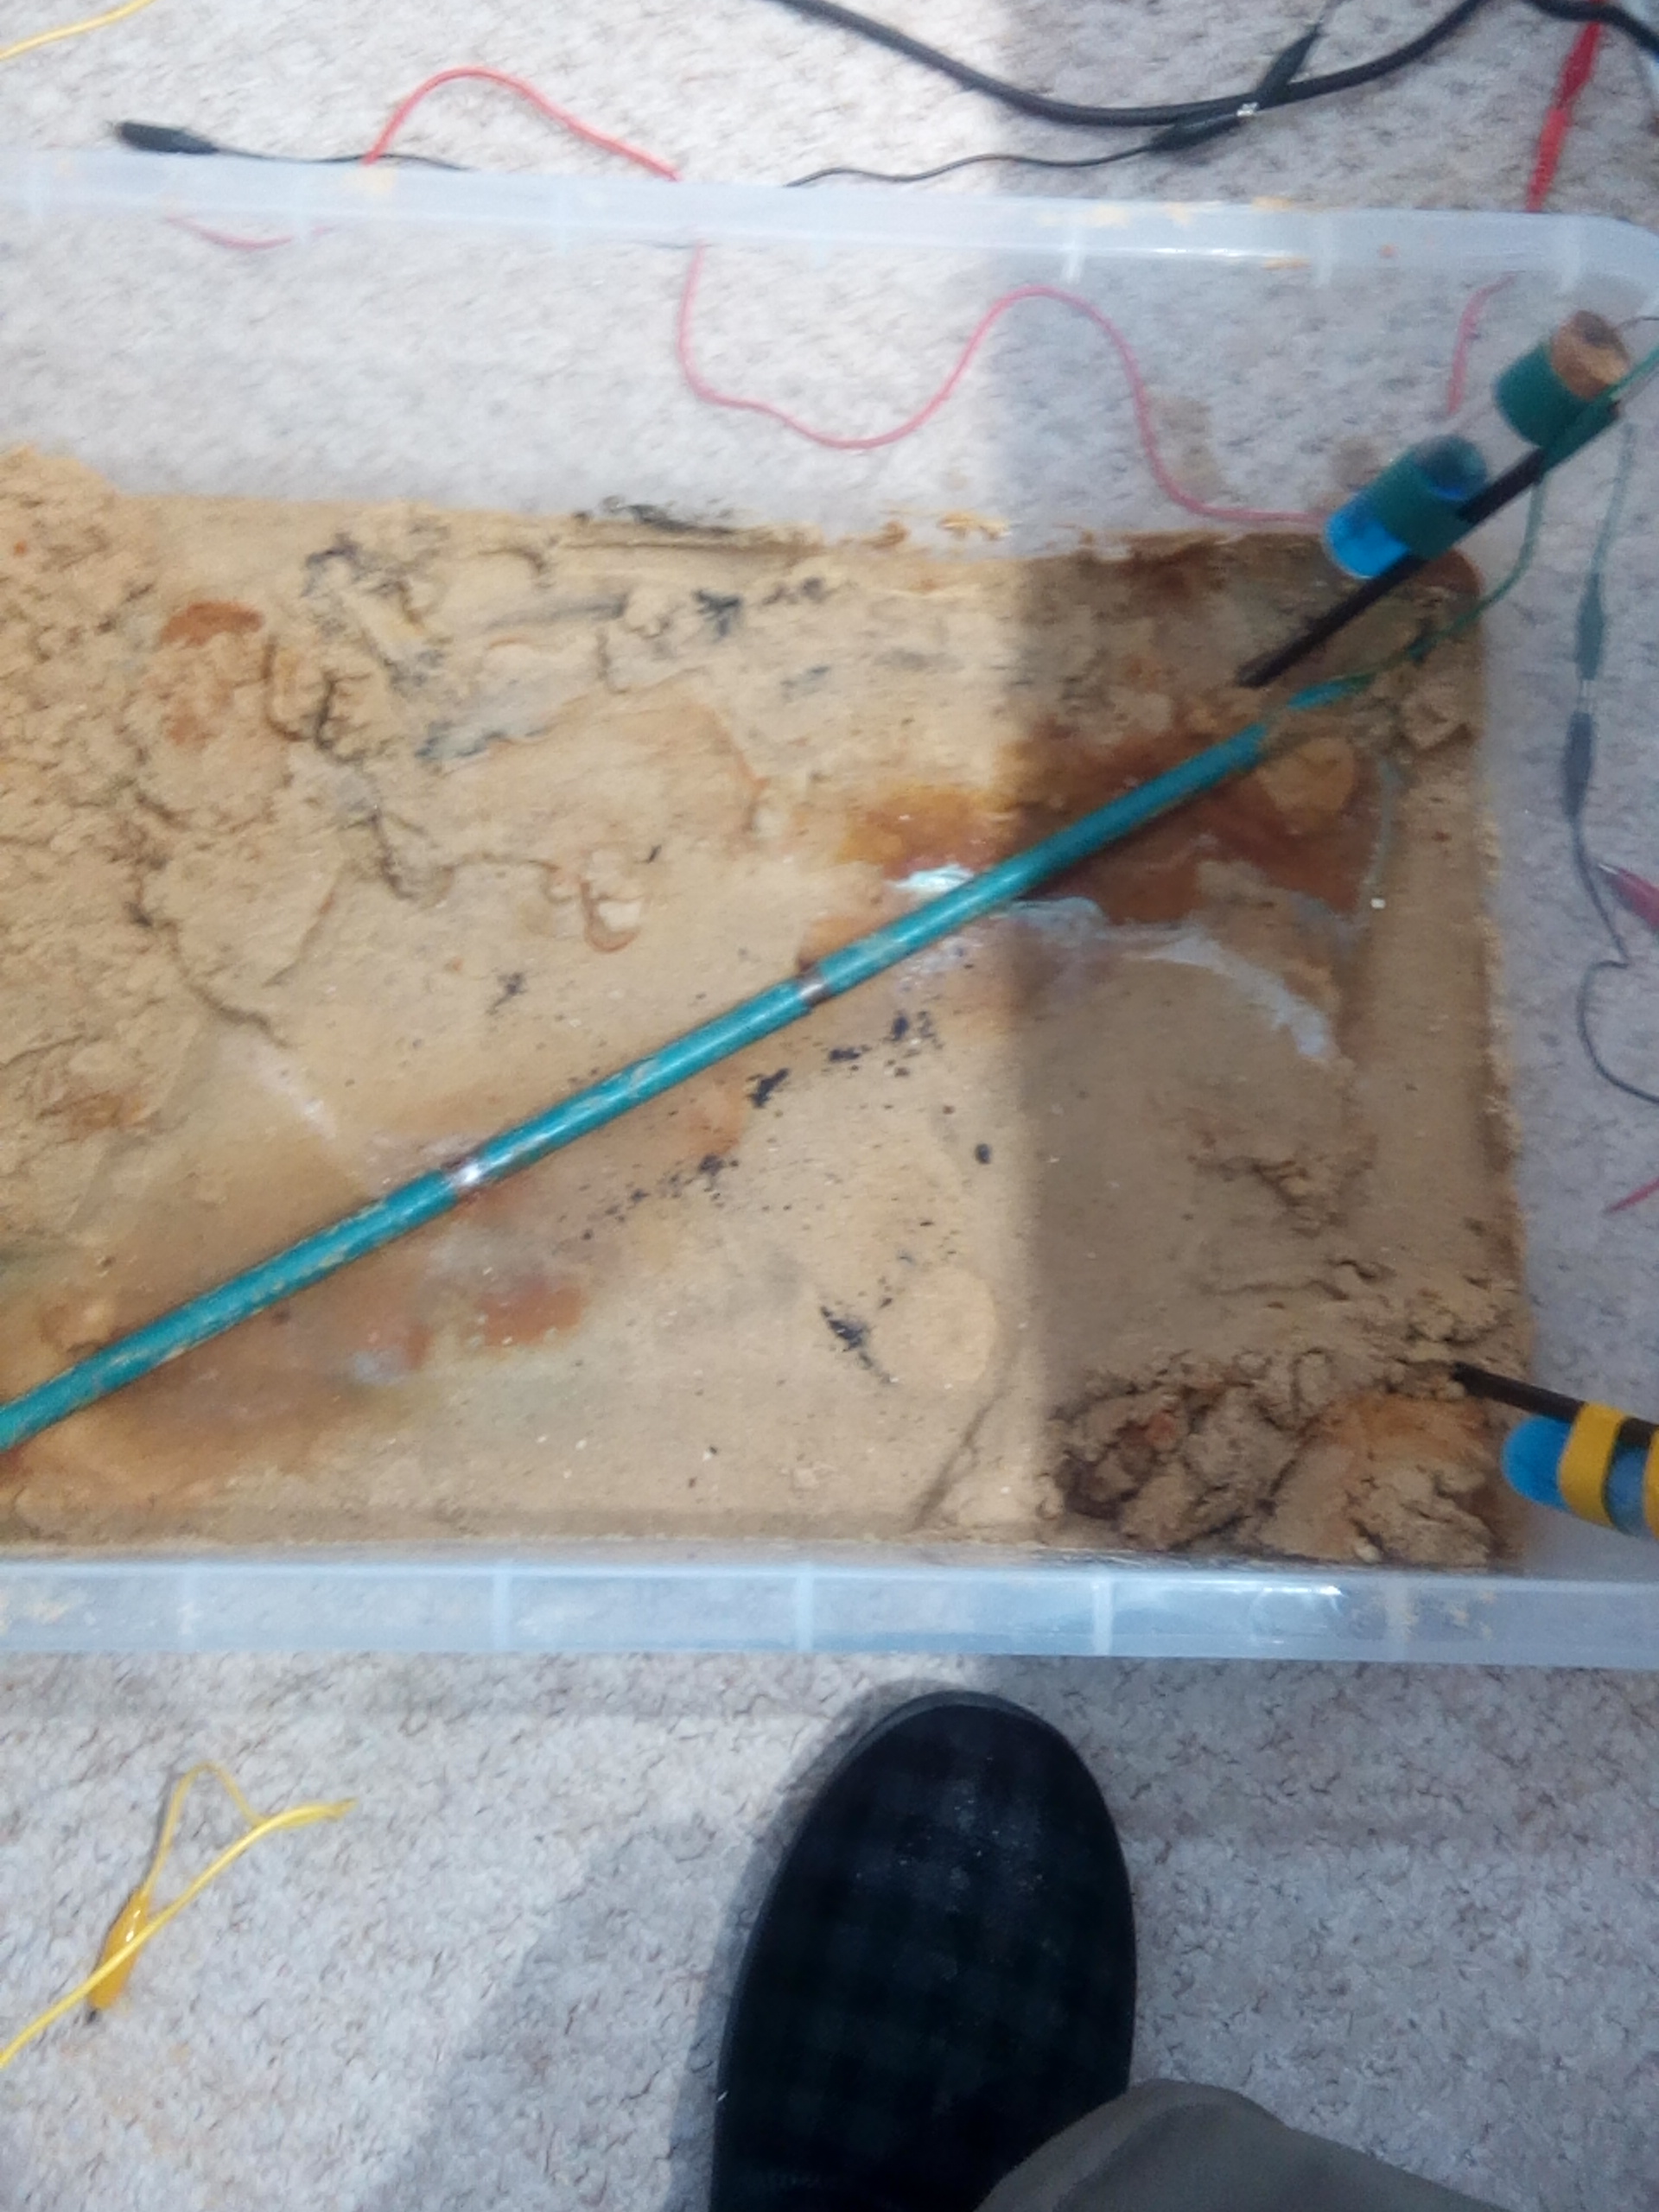
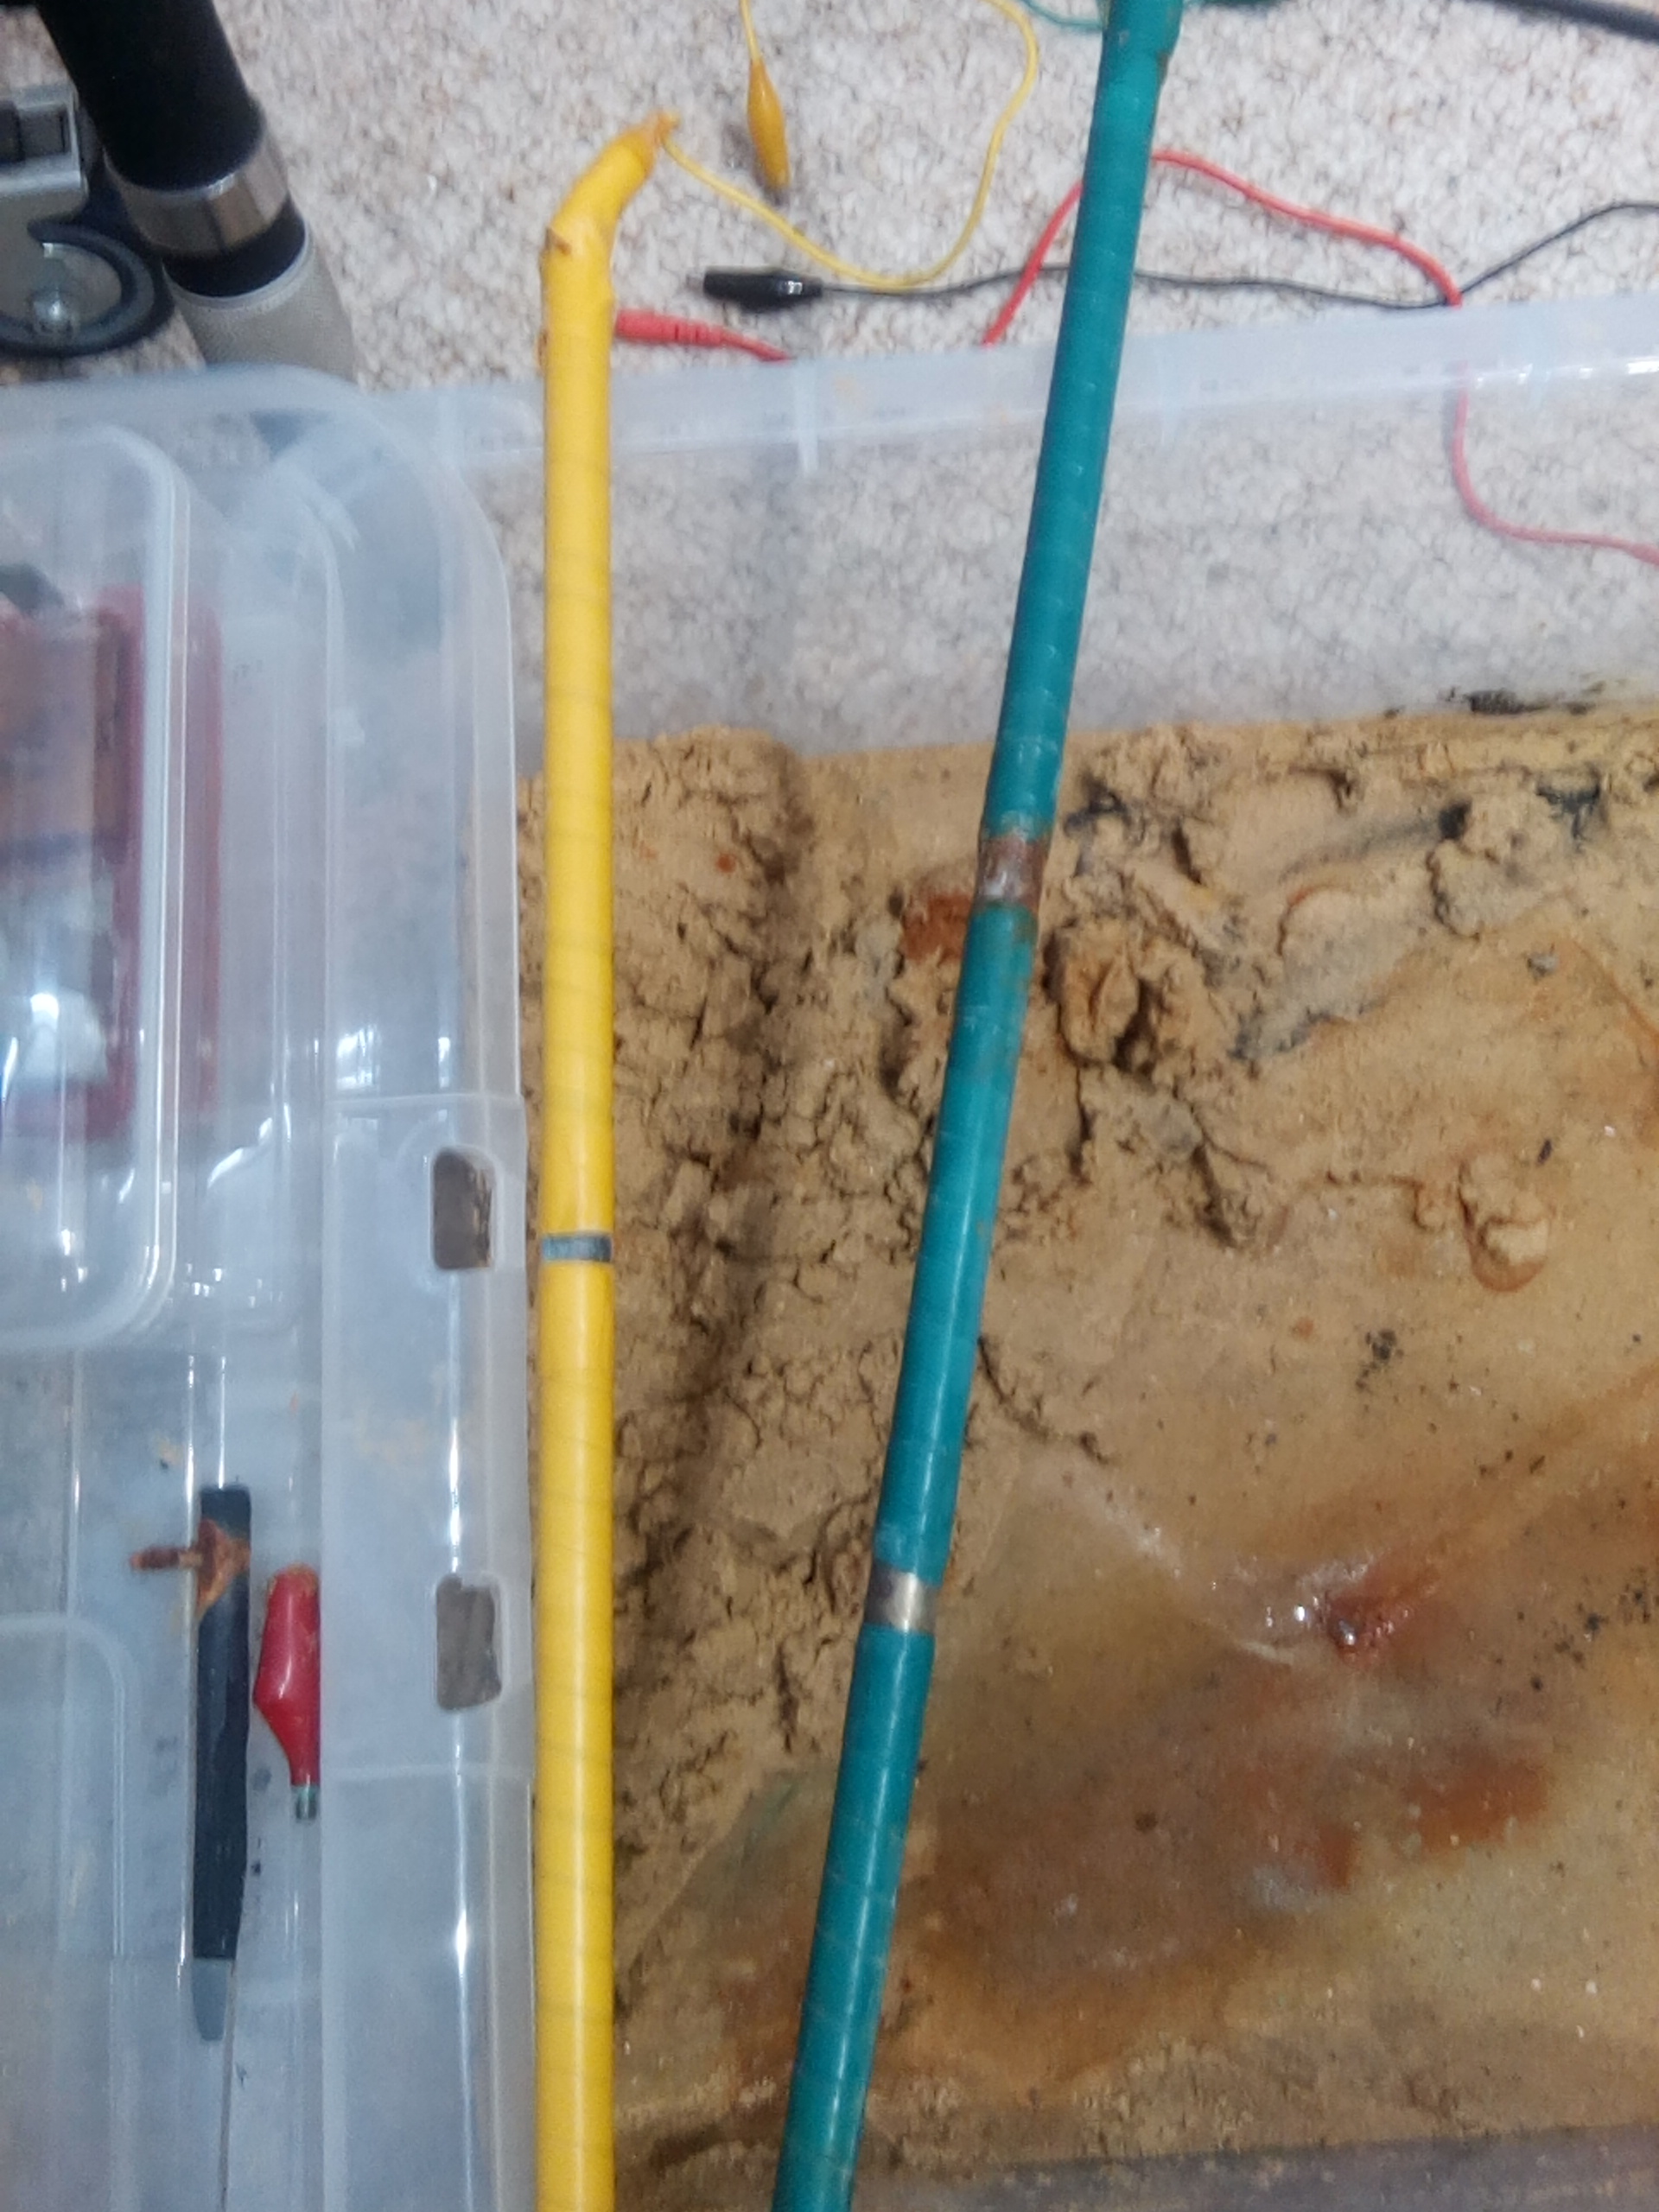
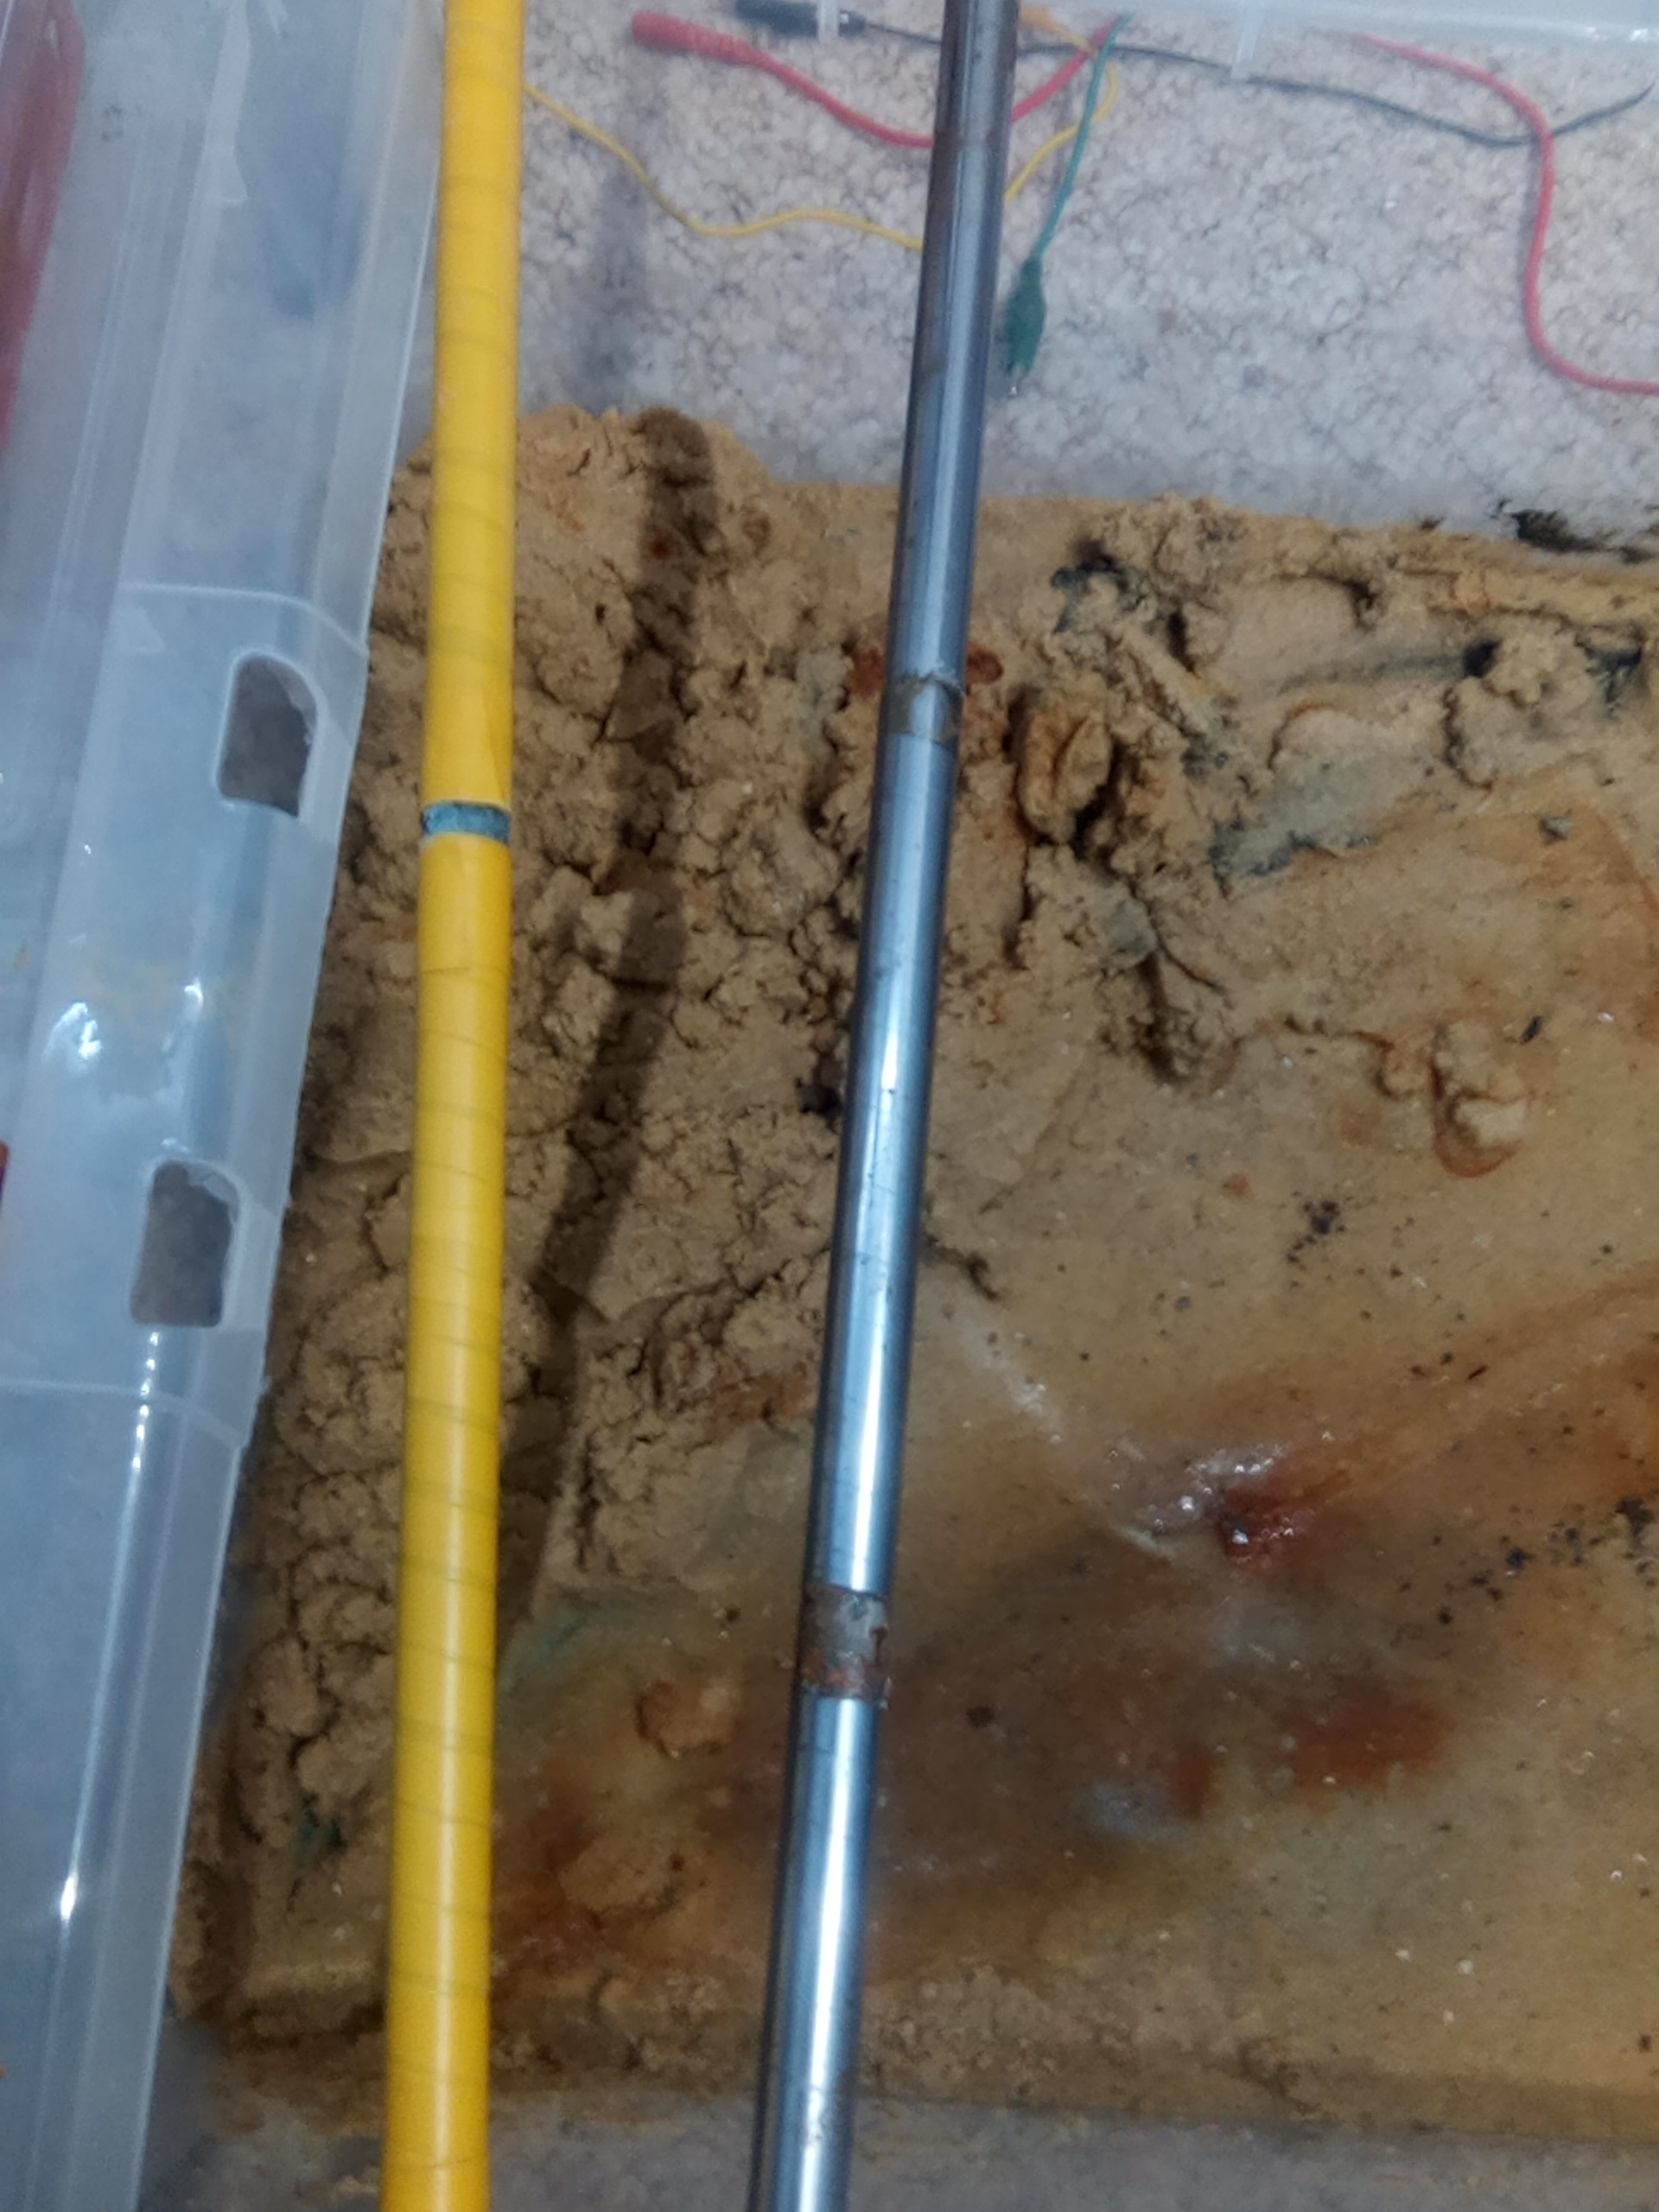
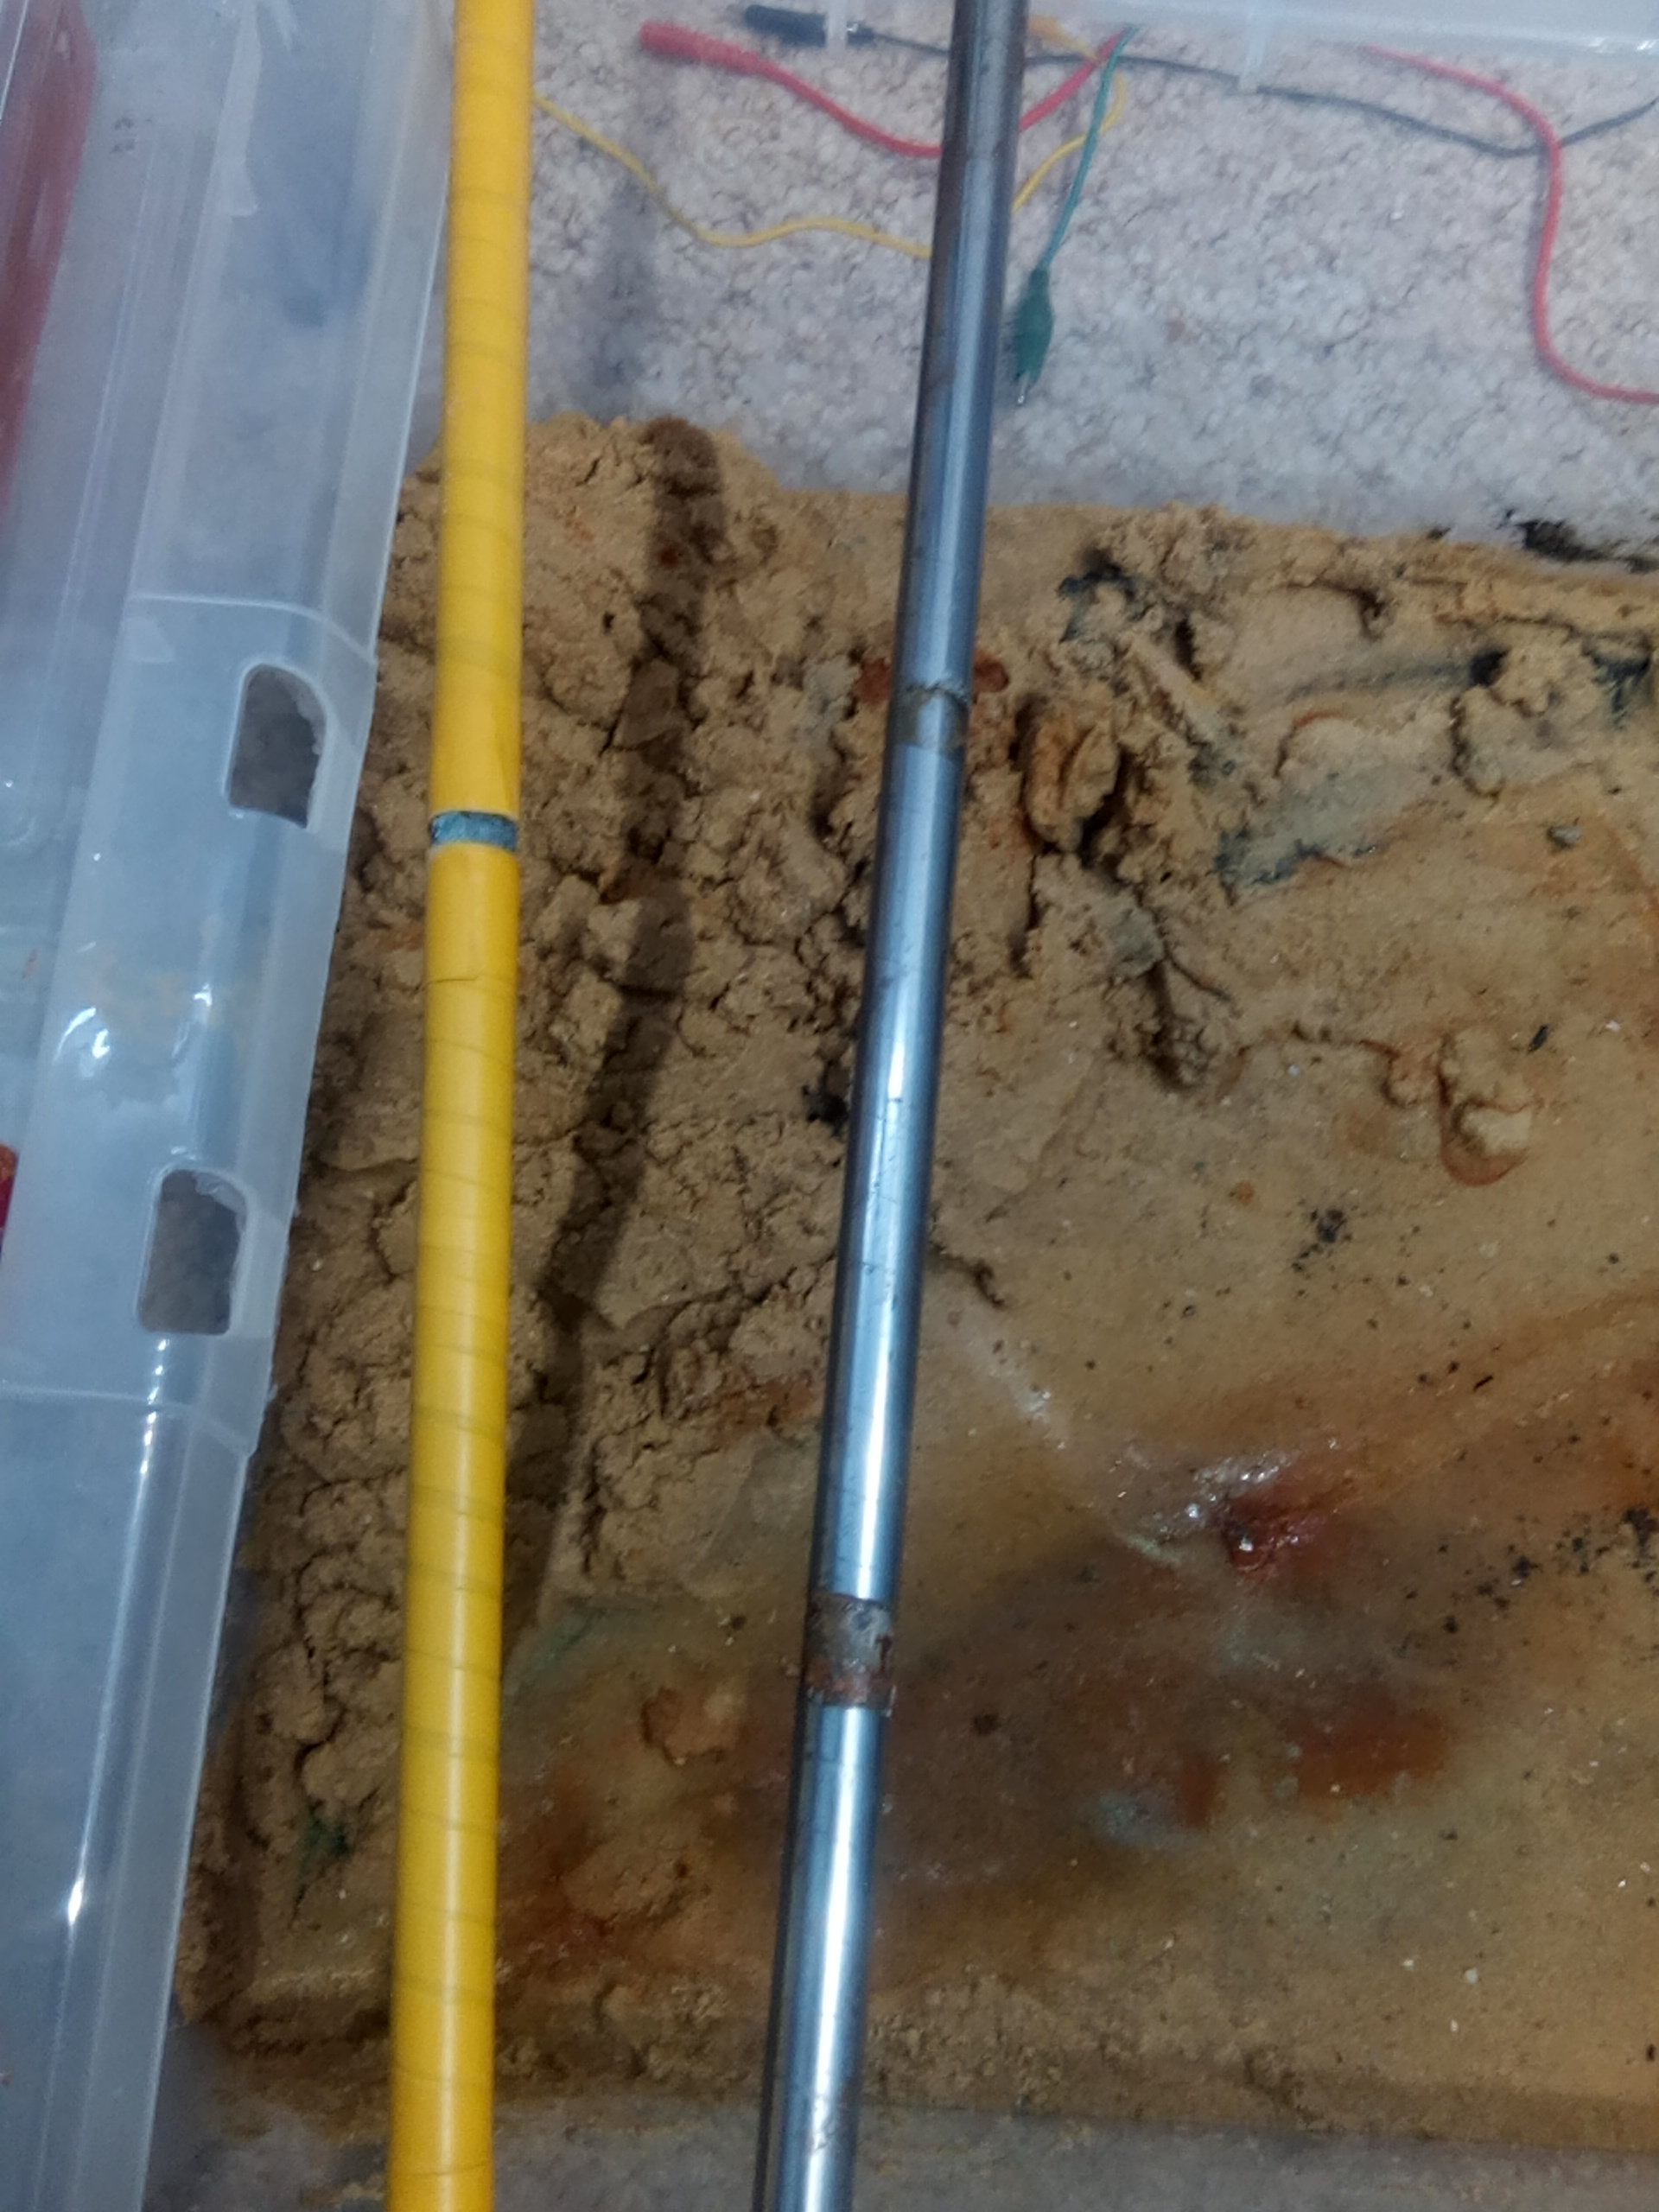
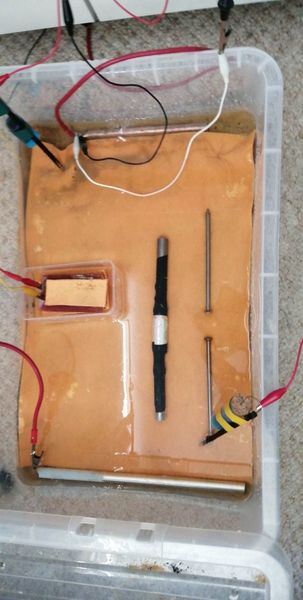
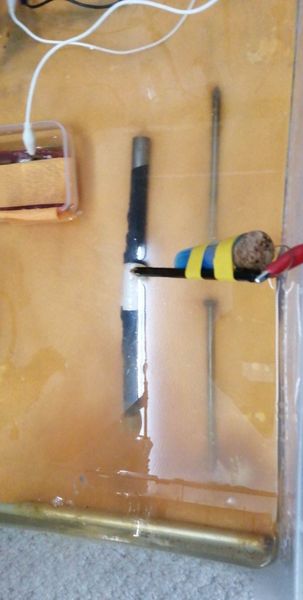
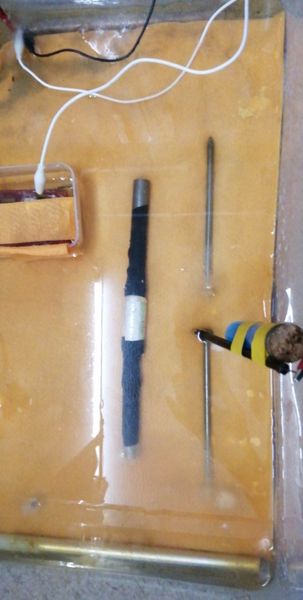
This picture shows the experiment set up to measure 'pipe-to-soil potentials that are the basis for traditional cathodic protection work.
2.
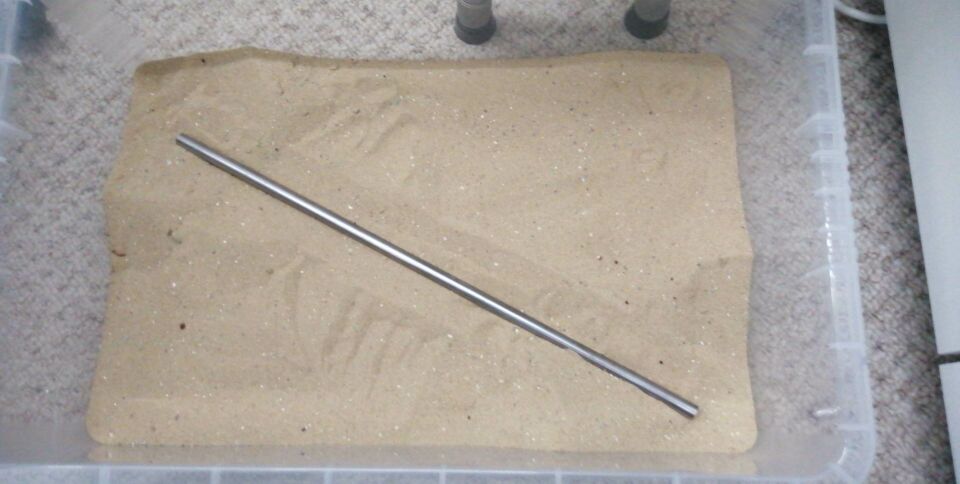
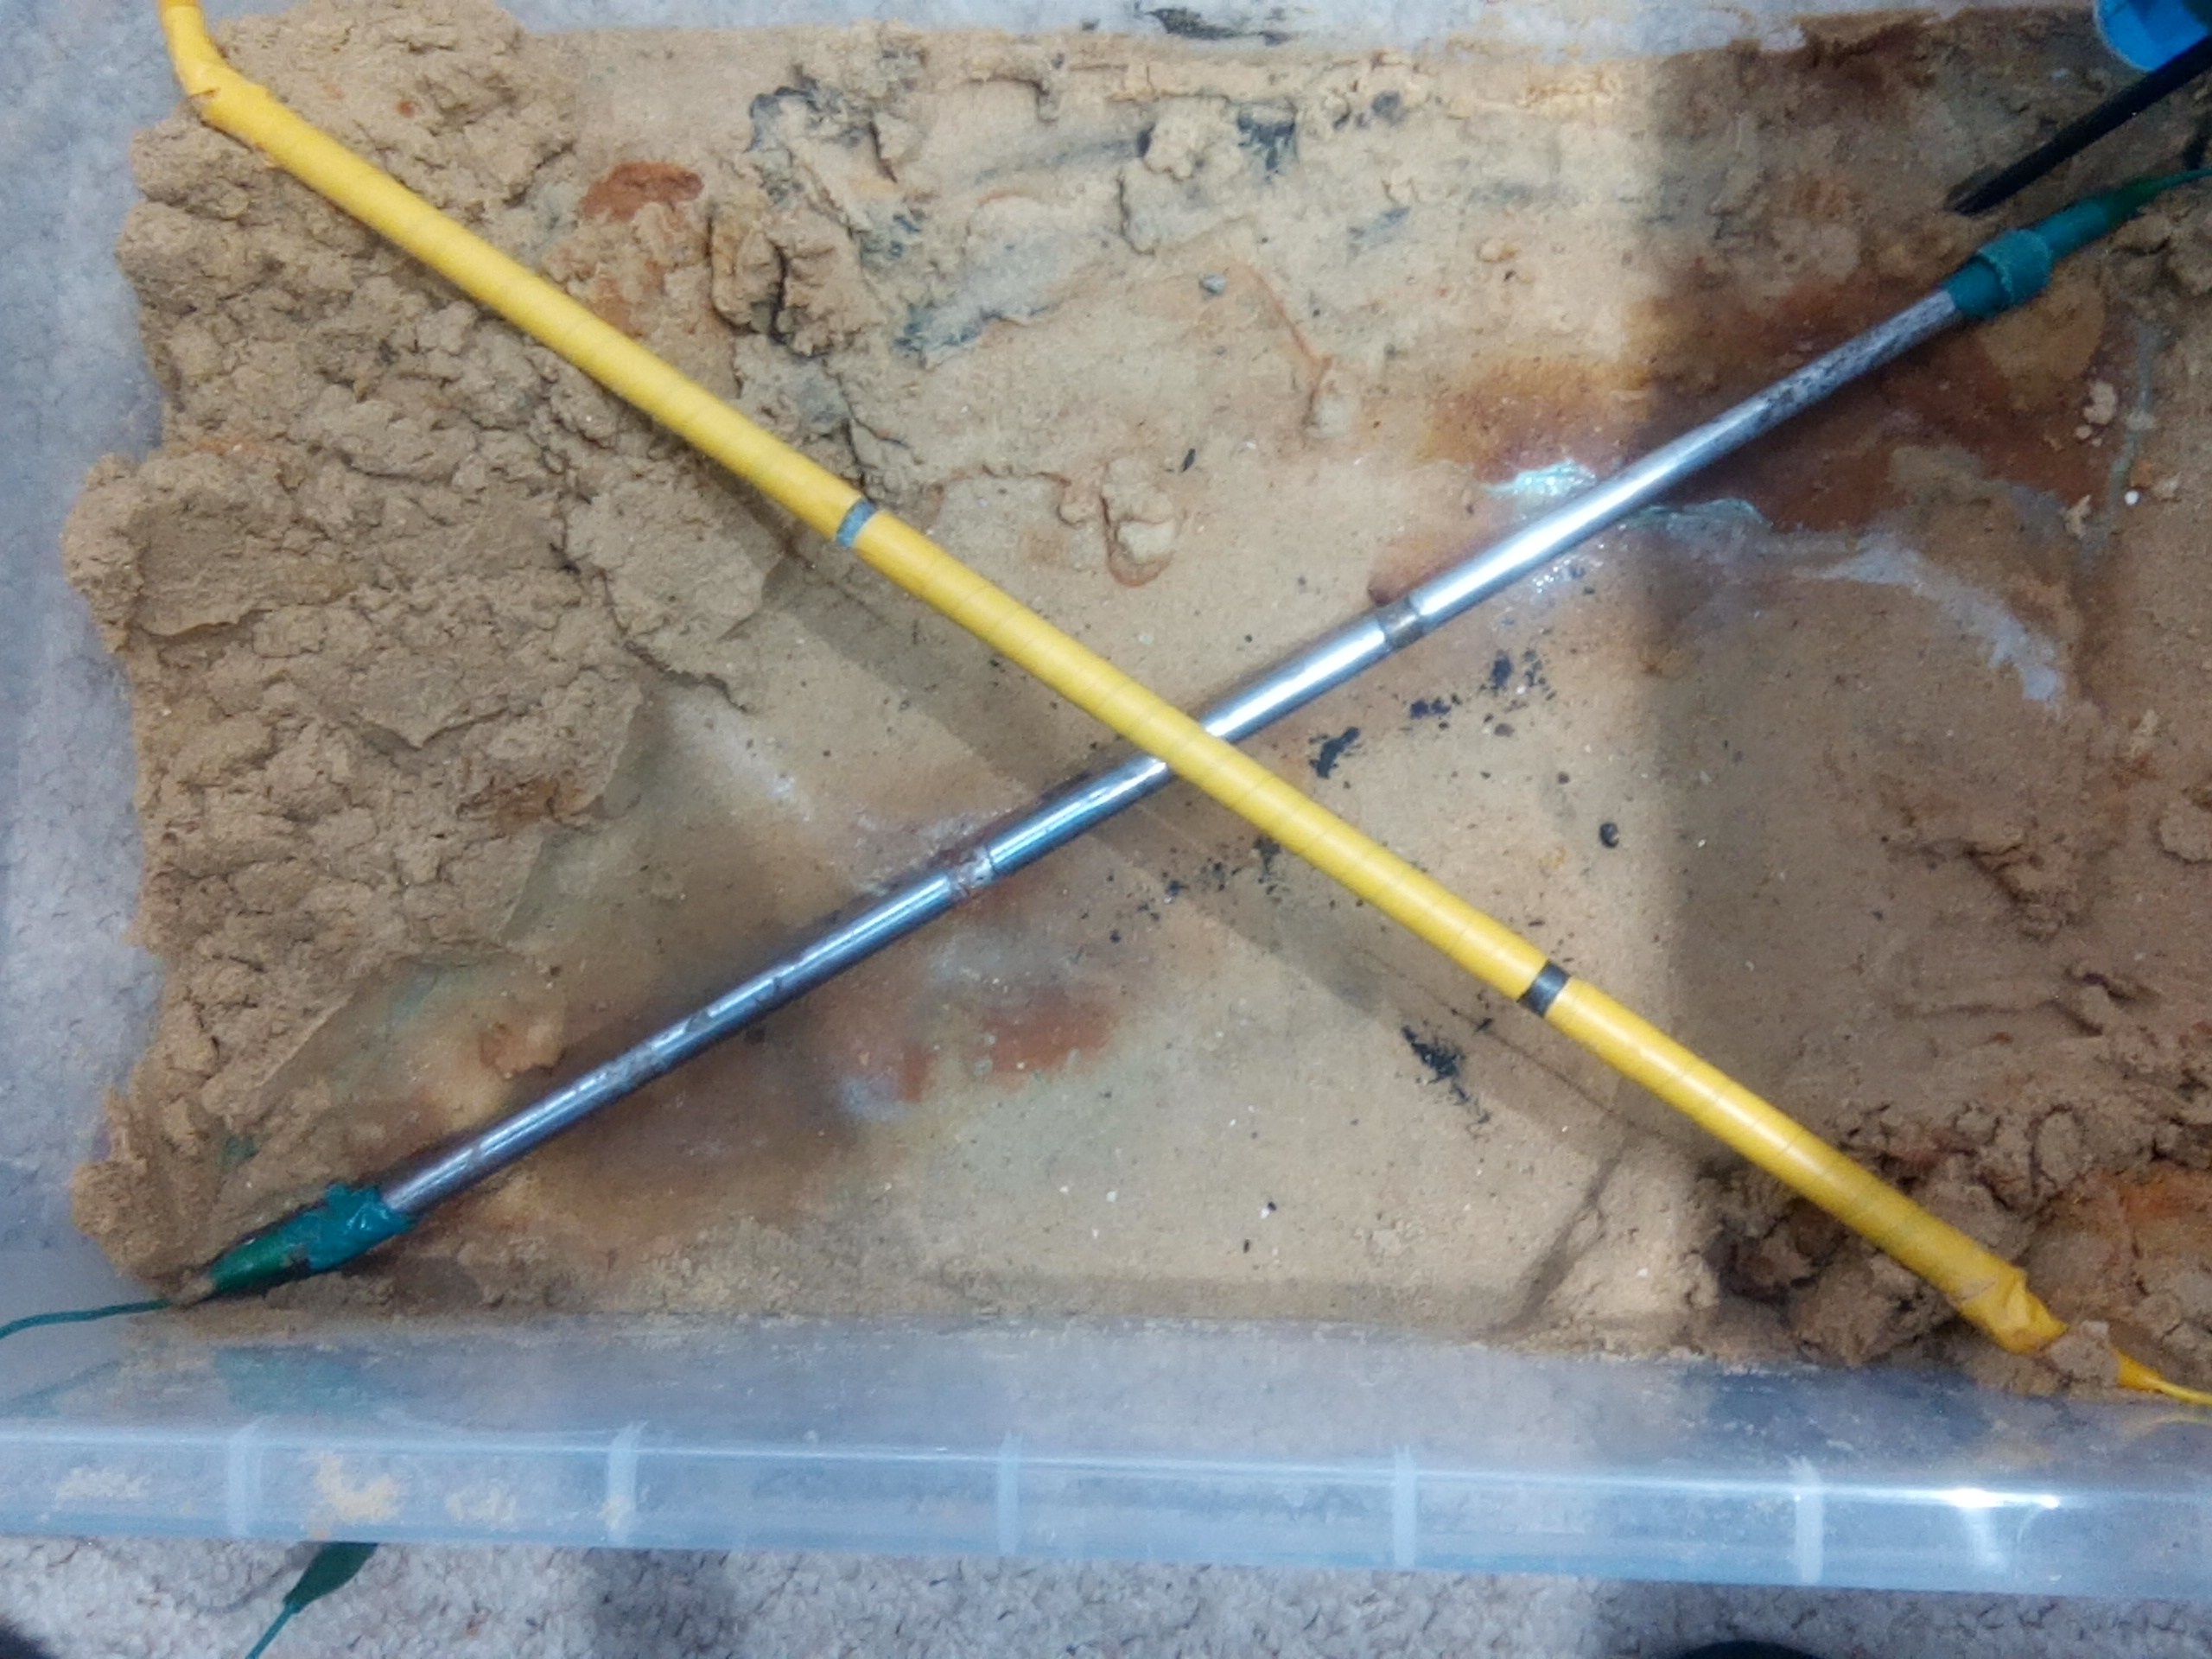
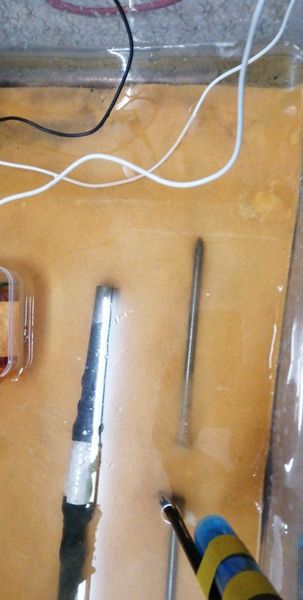
A bare mild steel pipe is seen in a trench in the dry sand.
3.
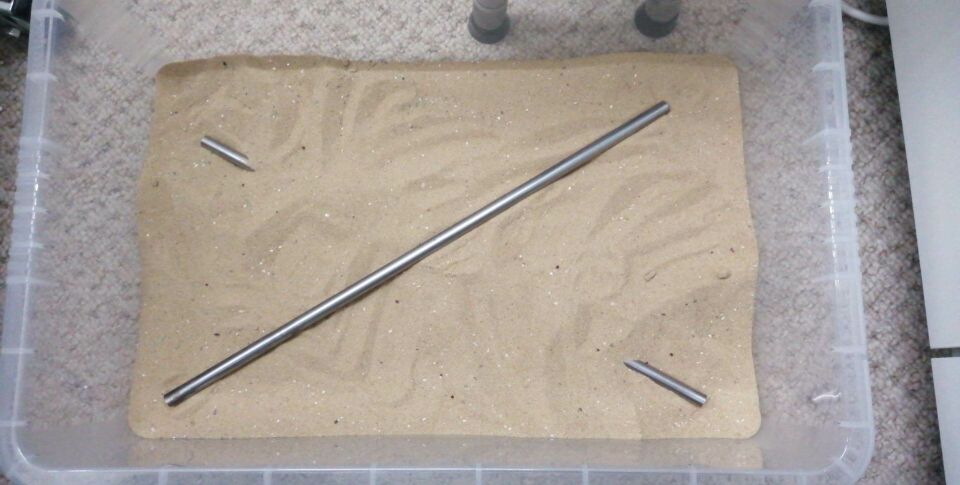
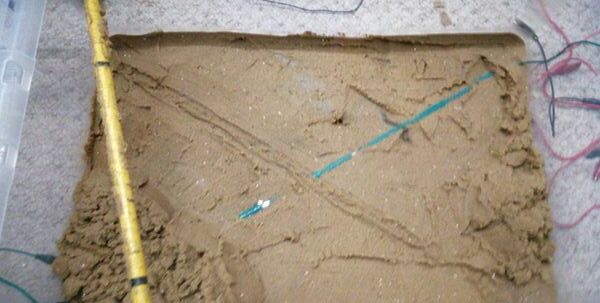
A second mild steel pipe is seen crossing the first, above but not touching the first.
4.
A second mild steel pipe is seen crossing the first, above but not touching the first.
5.
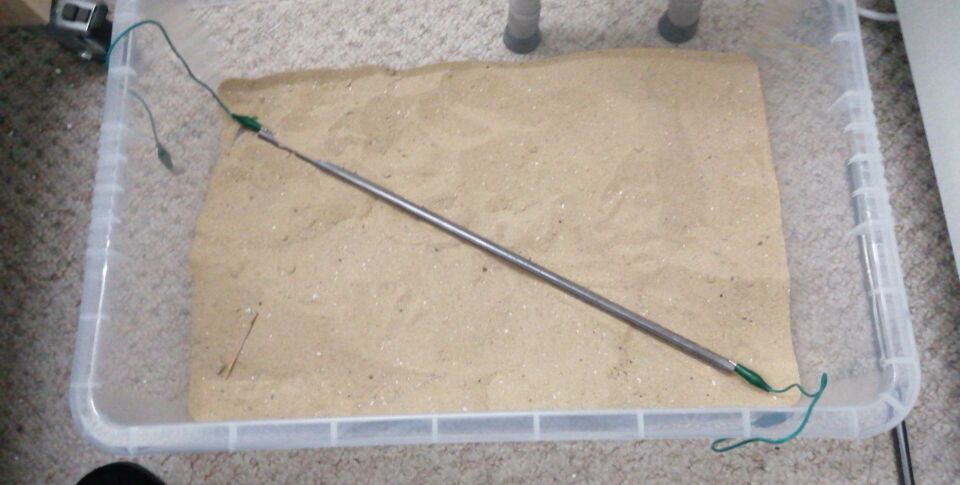
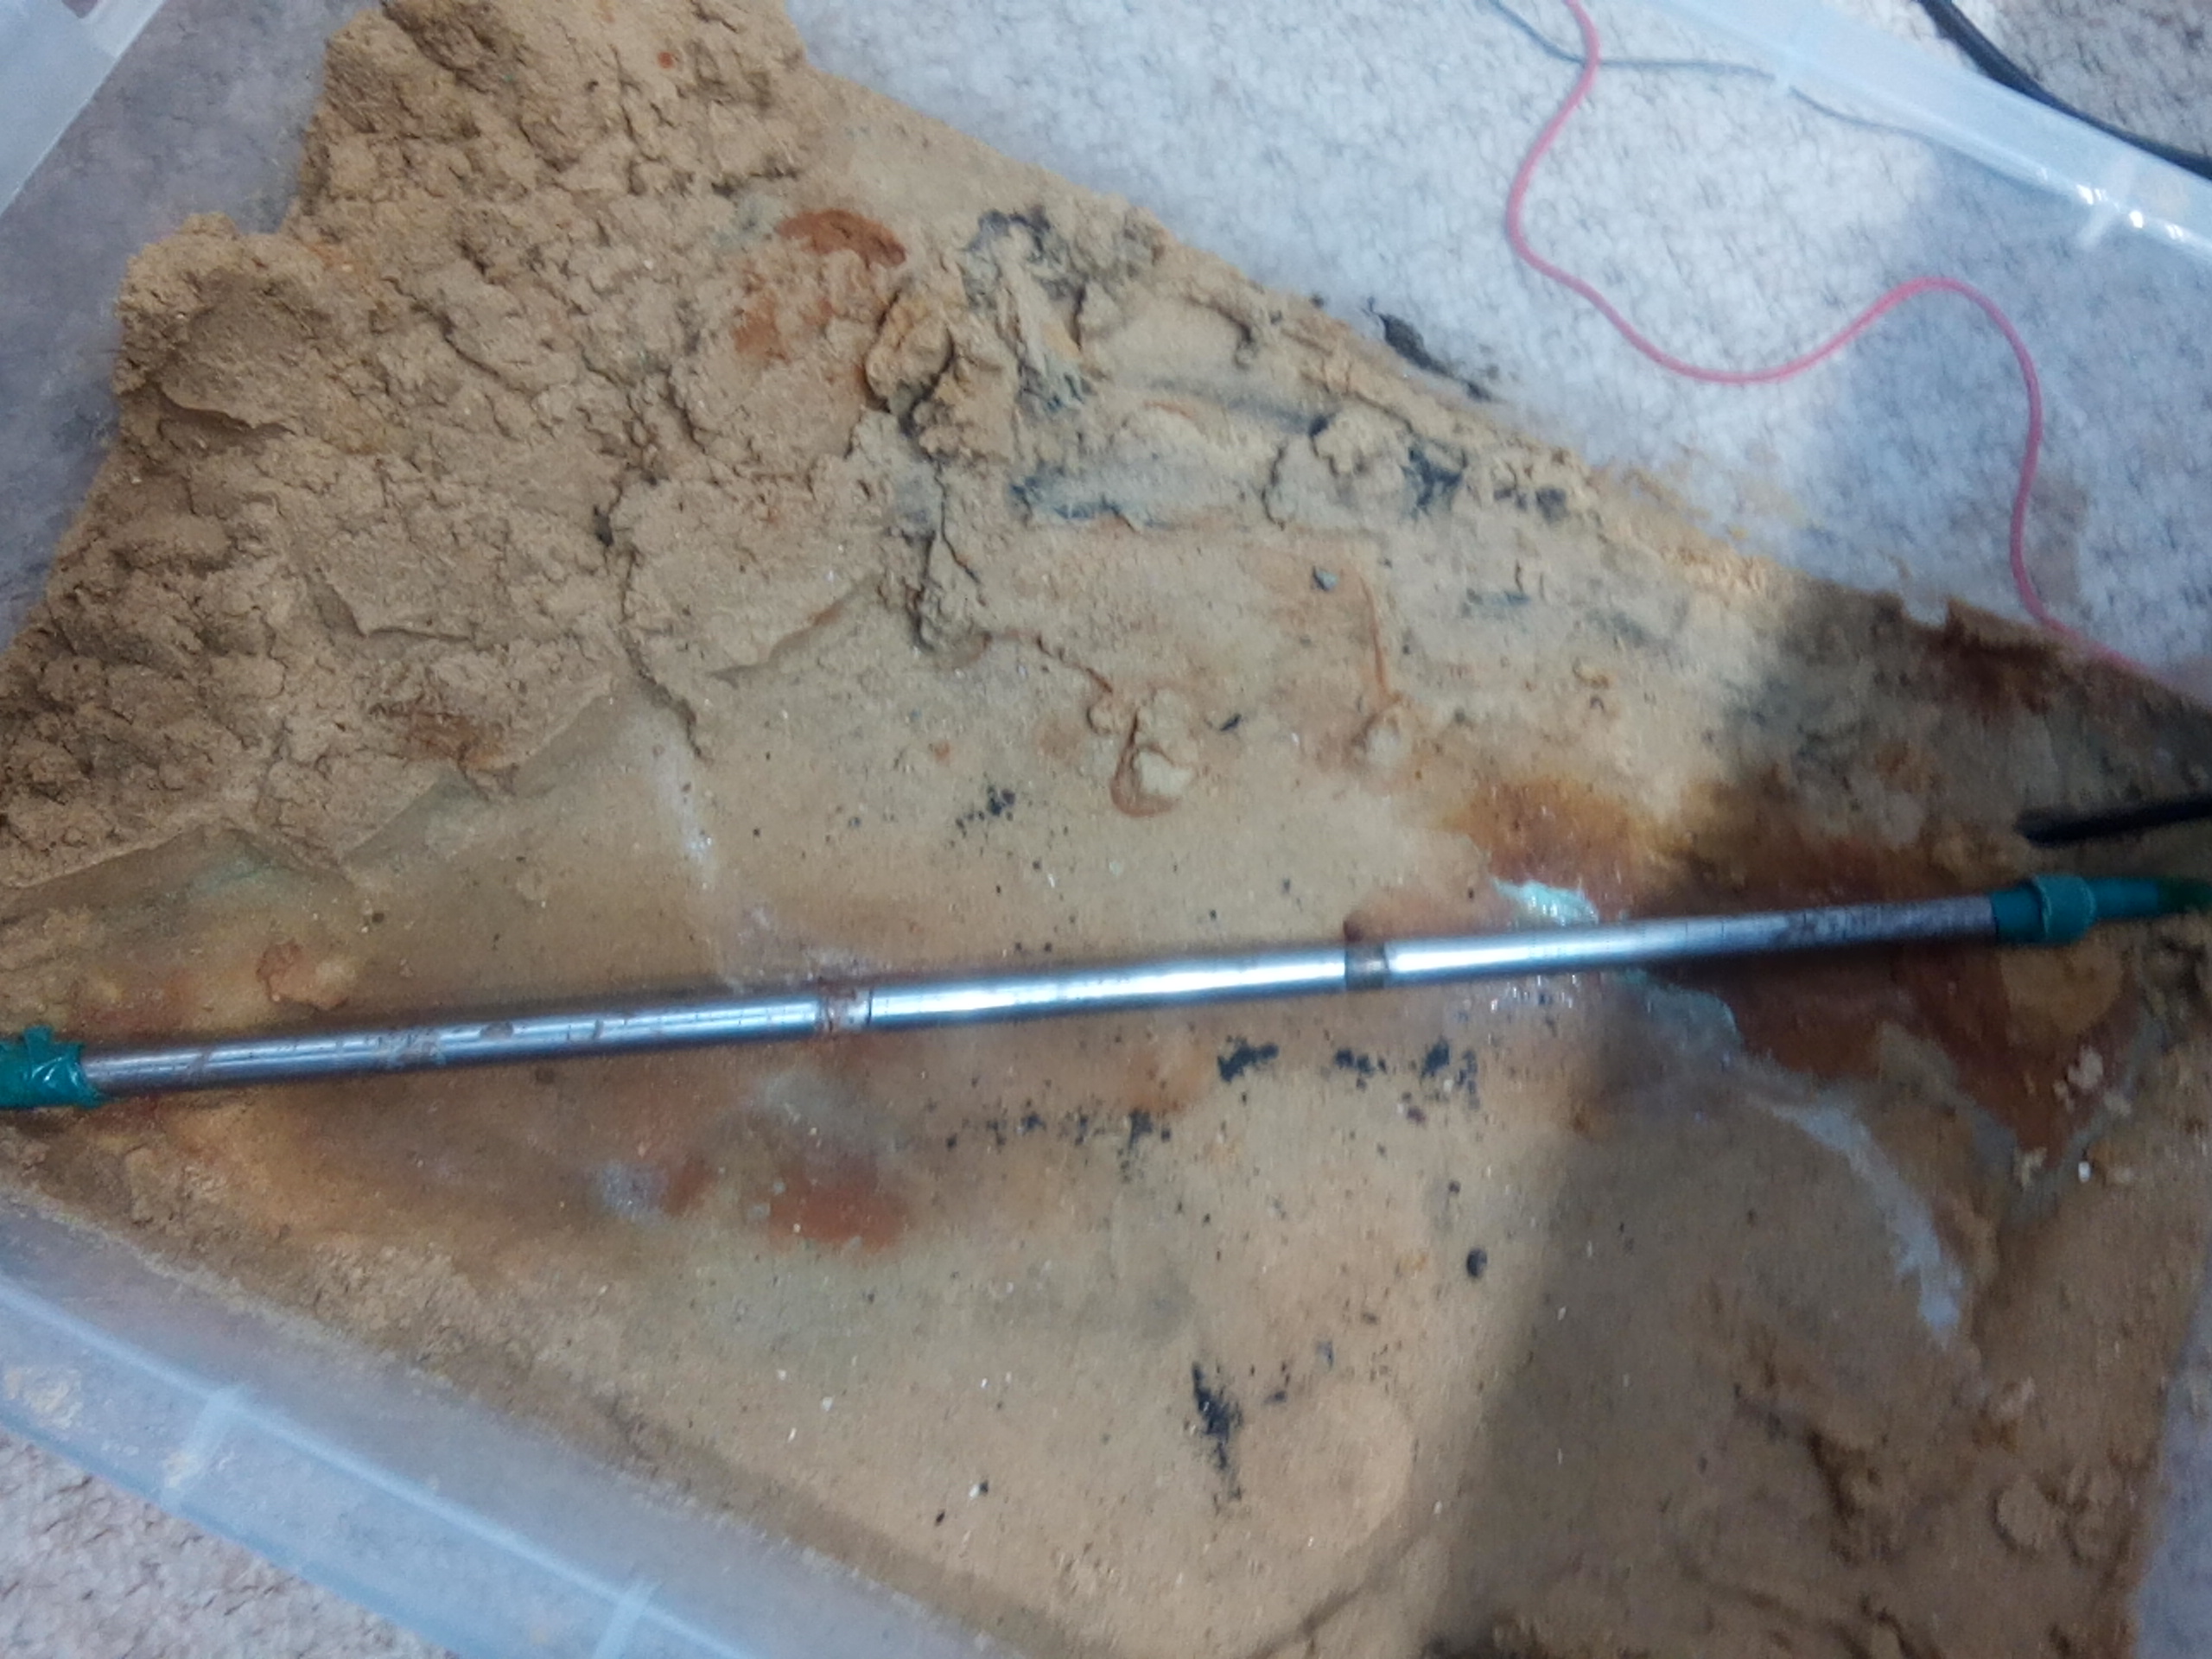
Jumper leads are attached to each end of each pipe
6.
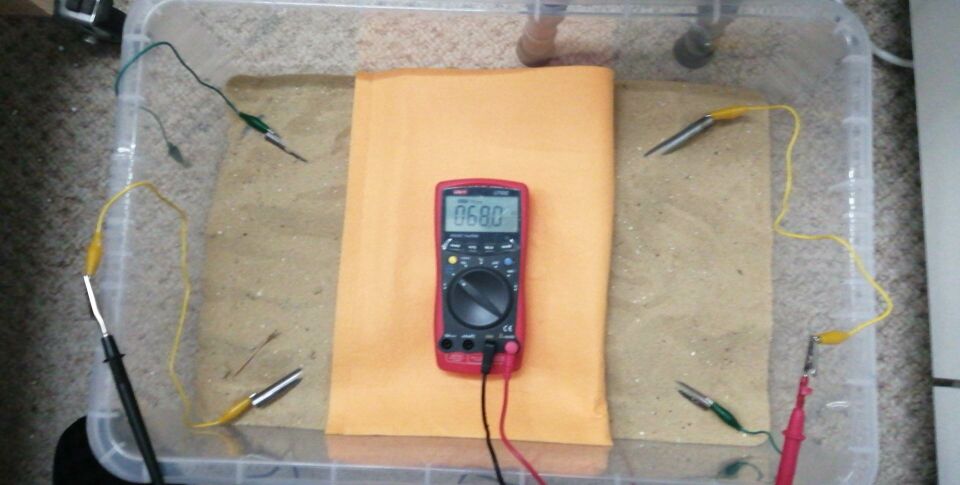
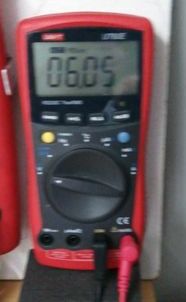
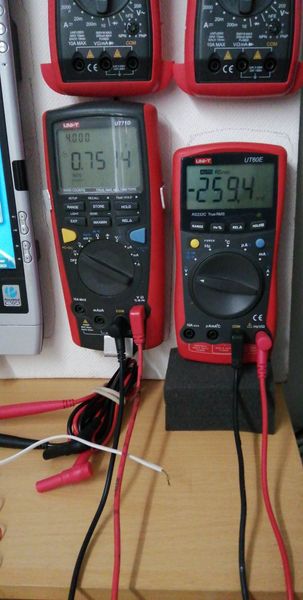
The multimeter is set to measure Ohms (resistance) and there is a resistance of 68kOhms between the two pipes in this dry sand, showing that it is not pure silicon.
7.
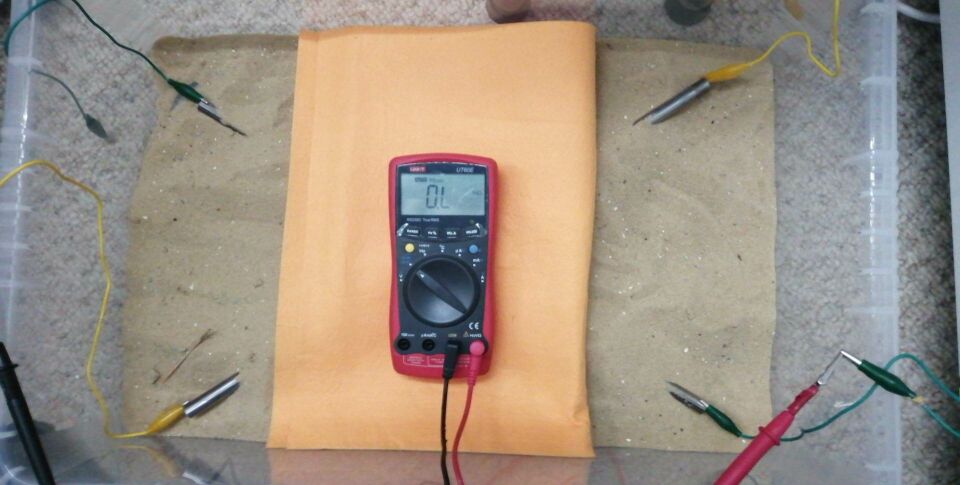
A second reading showed overload meaning that the resistance was greater than the resistance within the meter when the test leads were clear of the sand.
8.
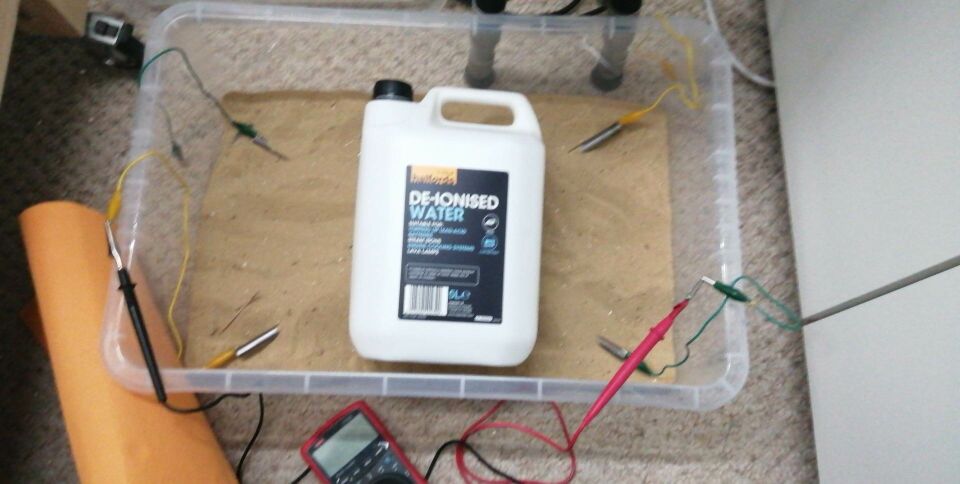
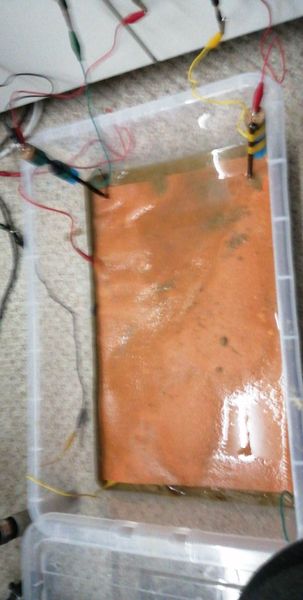
The pipes were removed from the sand and distilled water was added.
9.
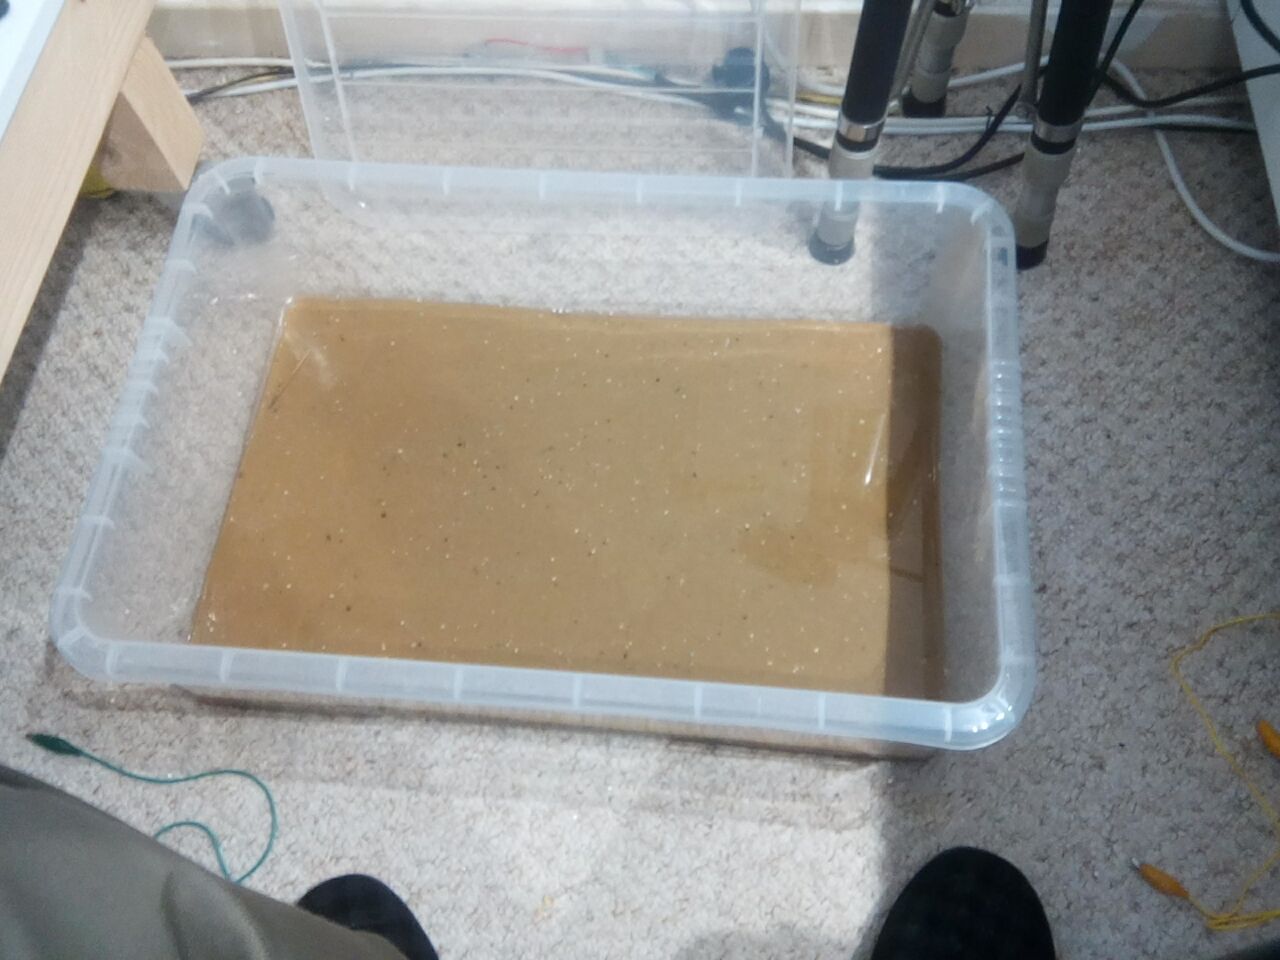
This picture shows the container with distilled water added to the sand
10.
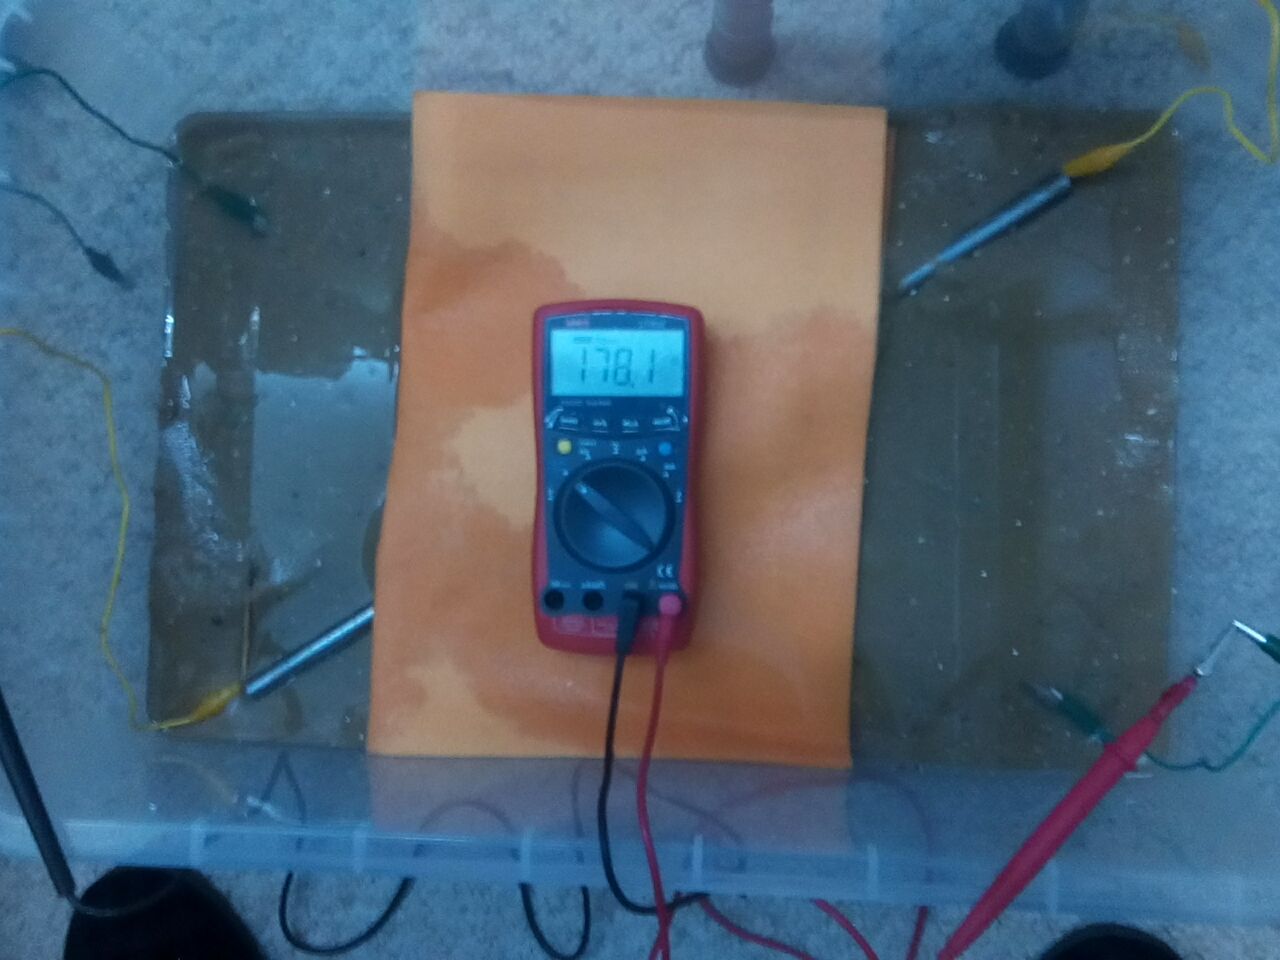
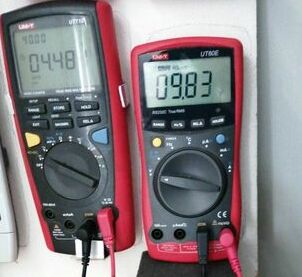
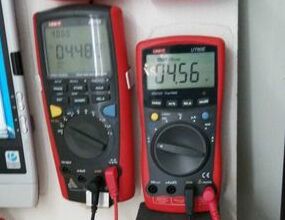
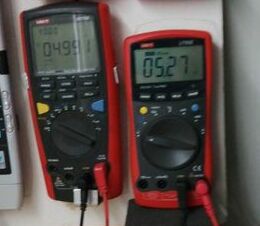
This shows the resistance readings when the distilled water was added.178.1 Ohms
11.
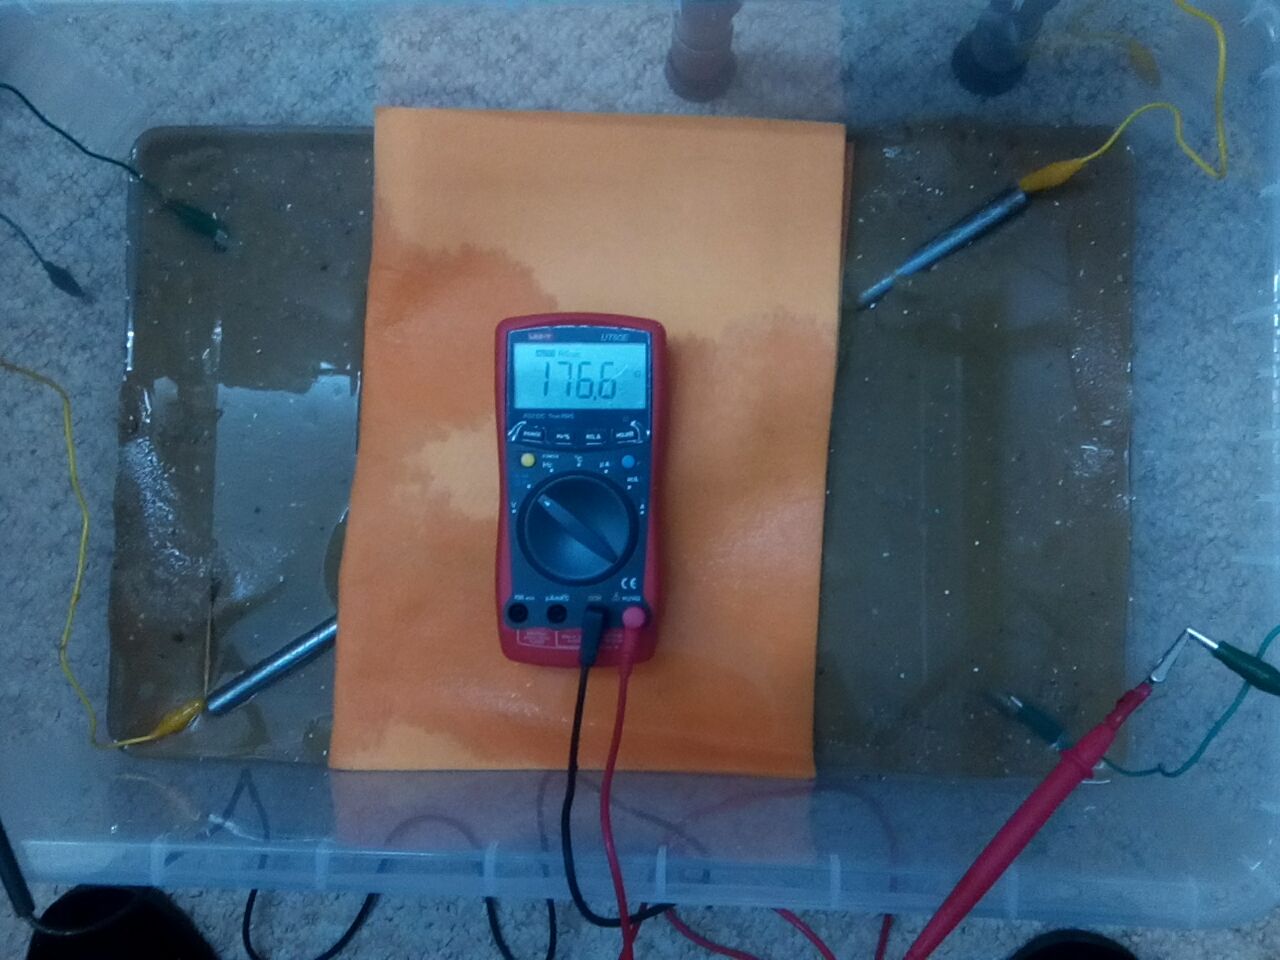
Meter reading 176.6 Ohms
12.
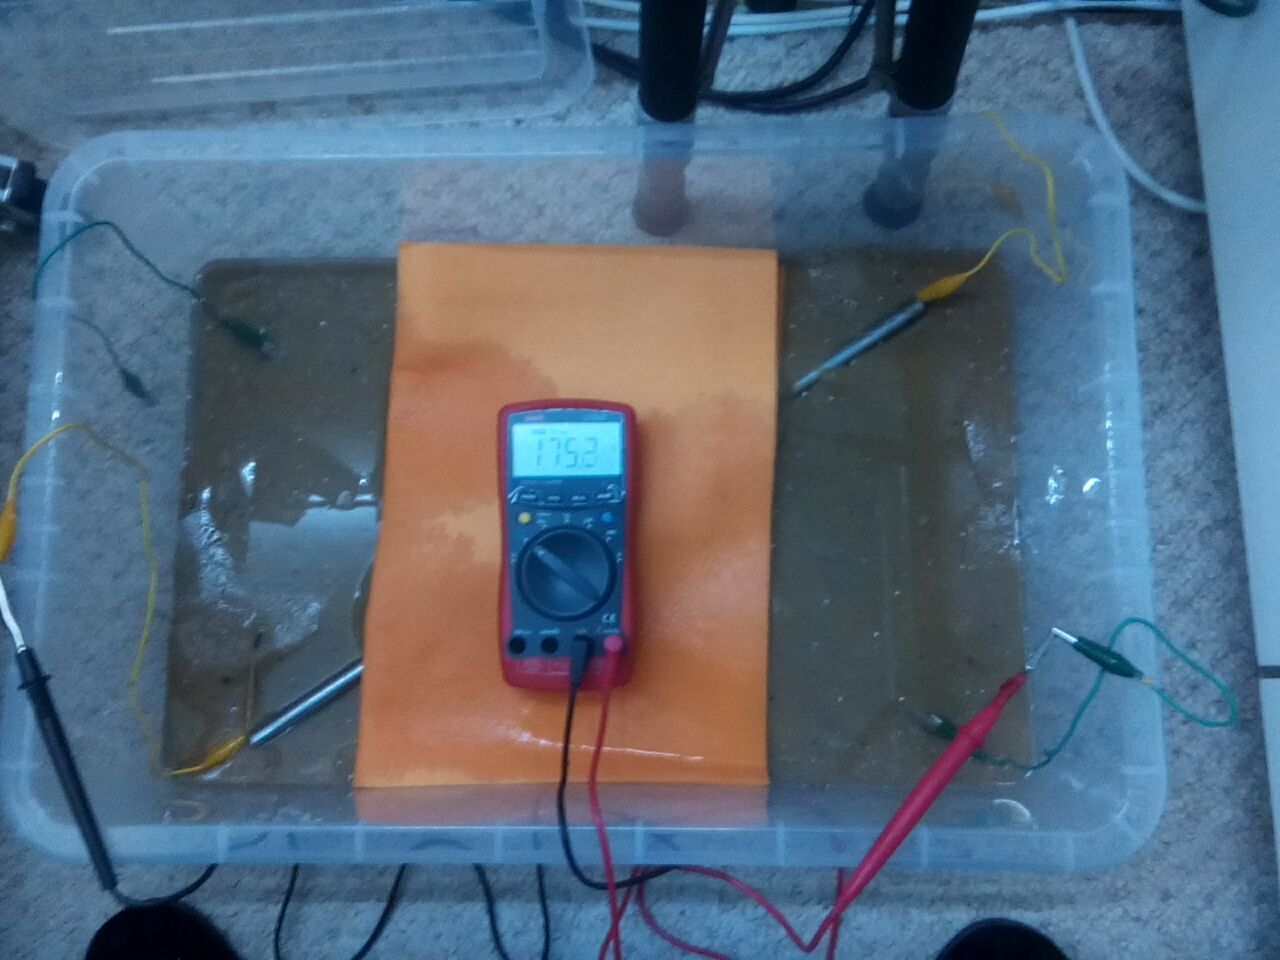
Meter reading 175.3 Ohms
13.
Salt (NaCl) was added to the water in the tray.
14.
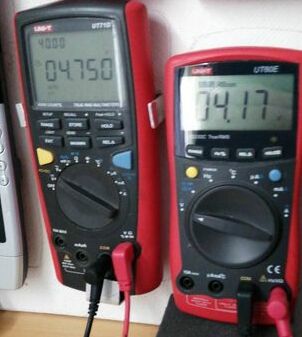
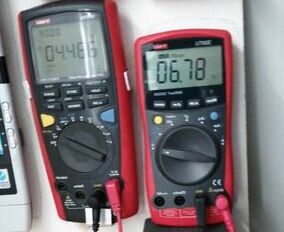
A resistance measurement was made with the salt water between the bare steel pipes
15.
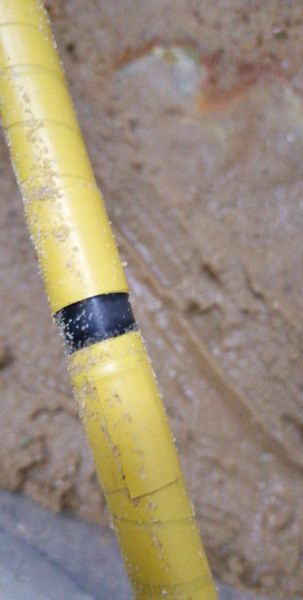
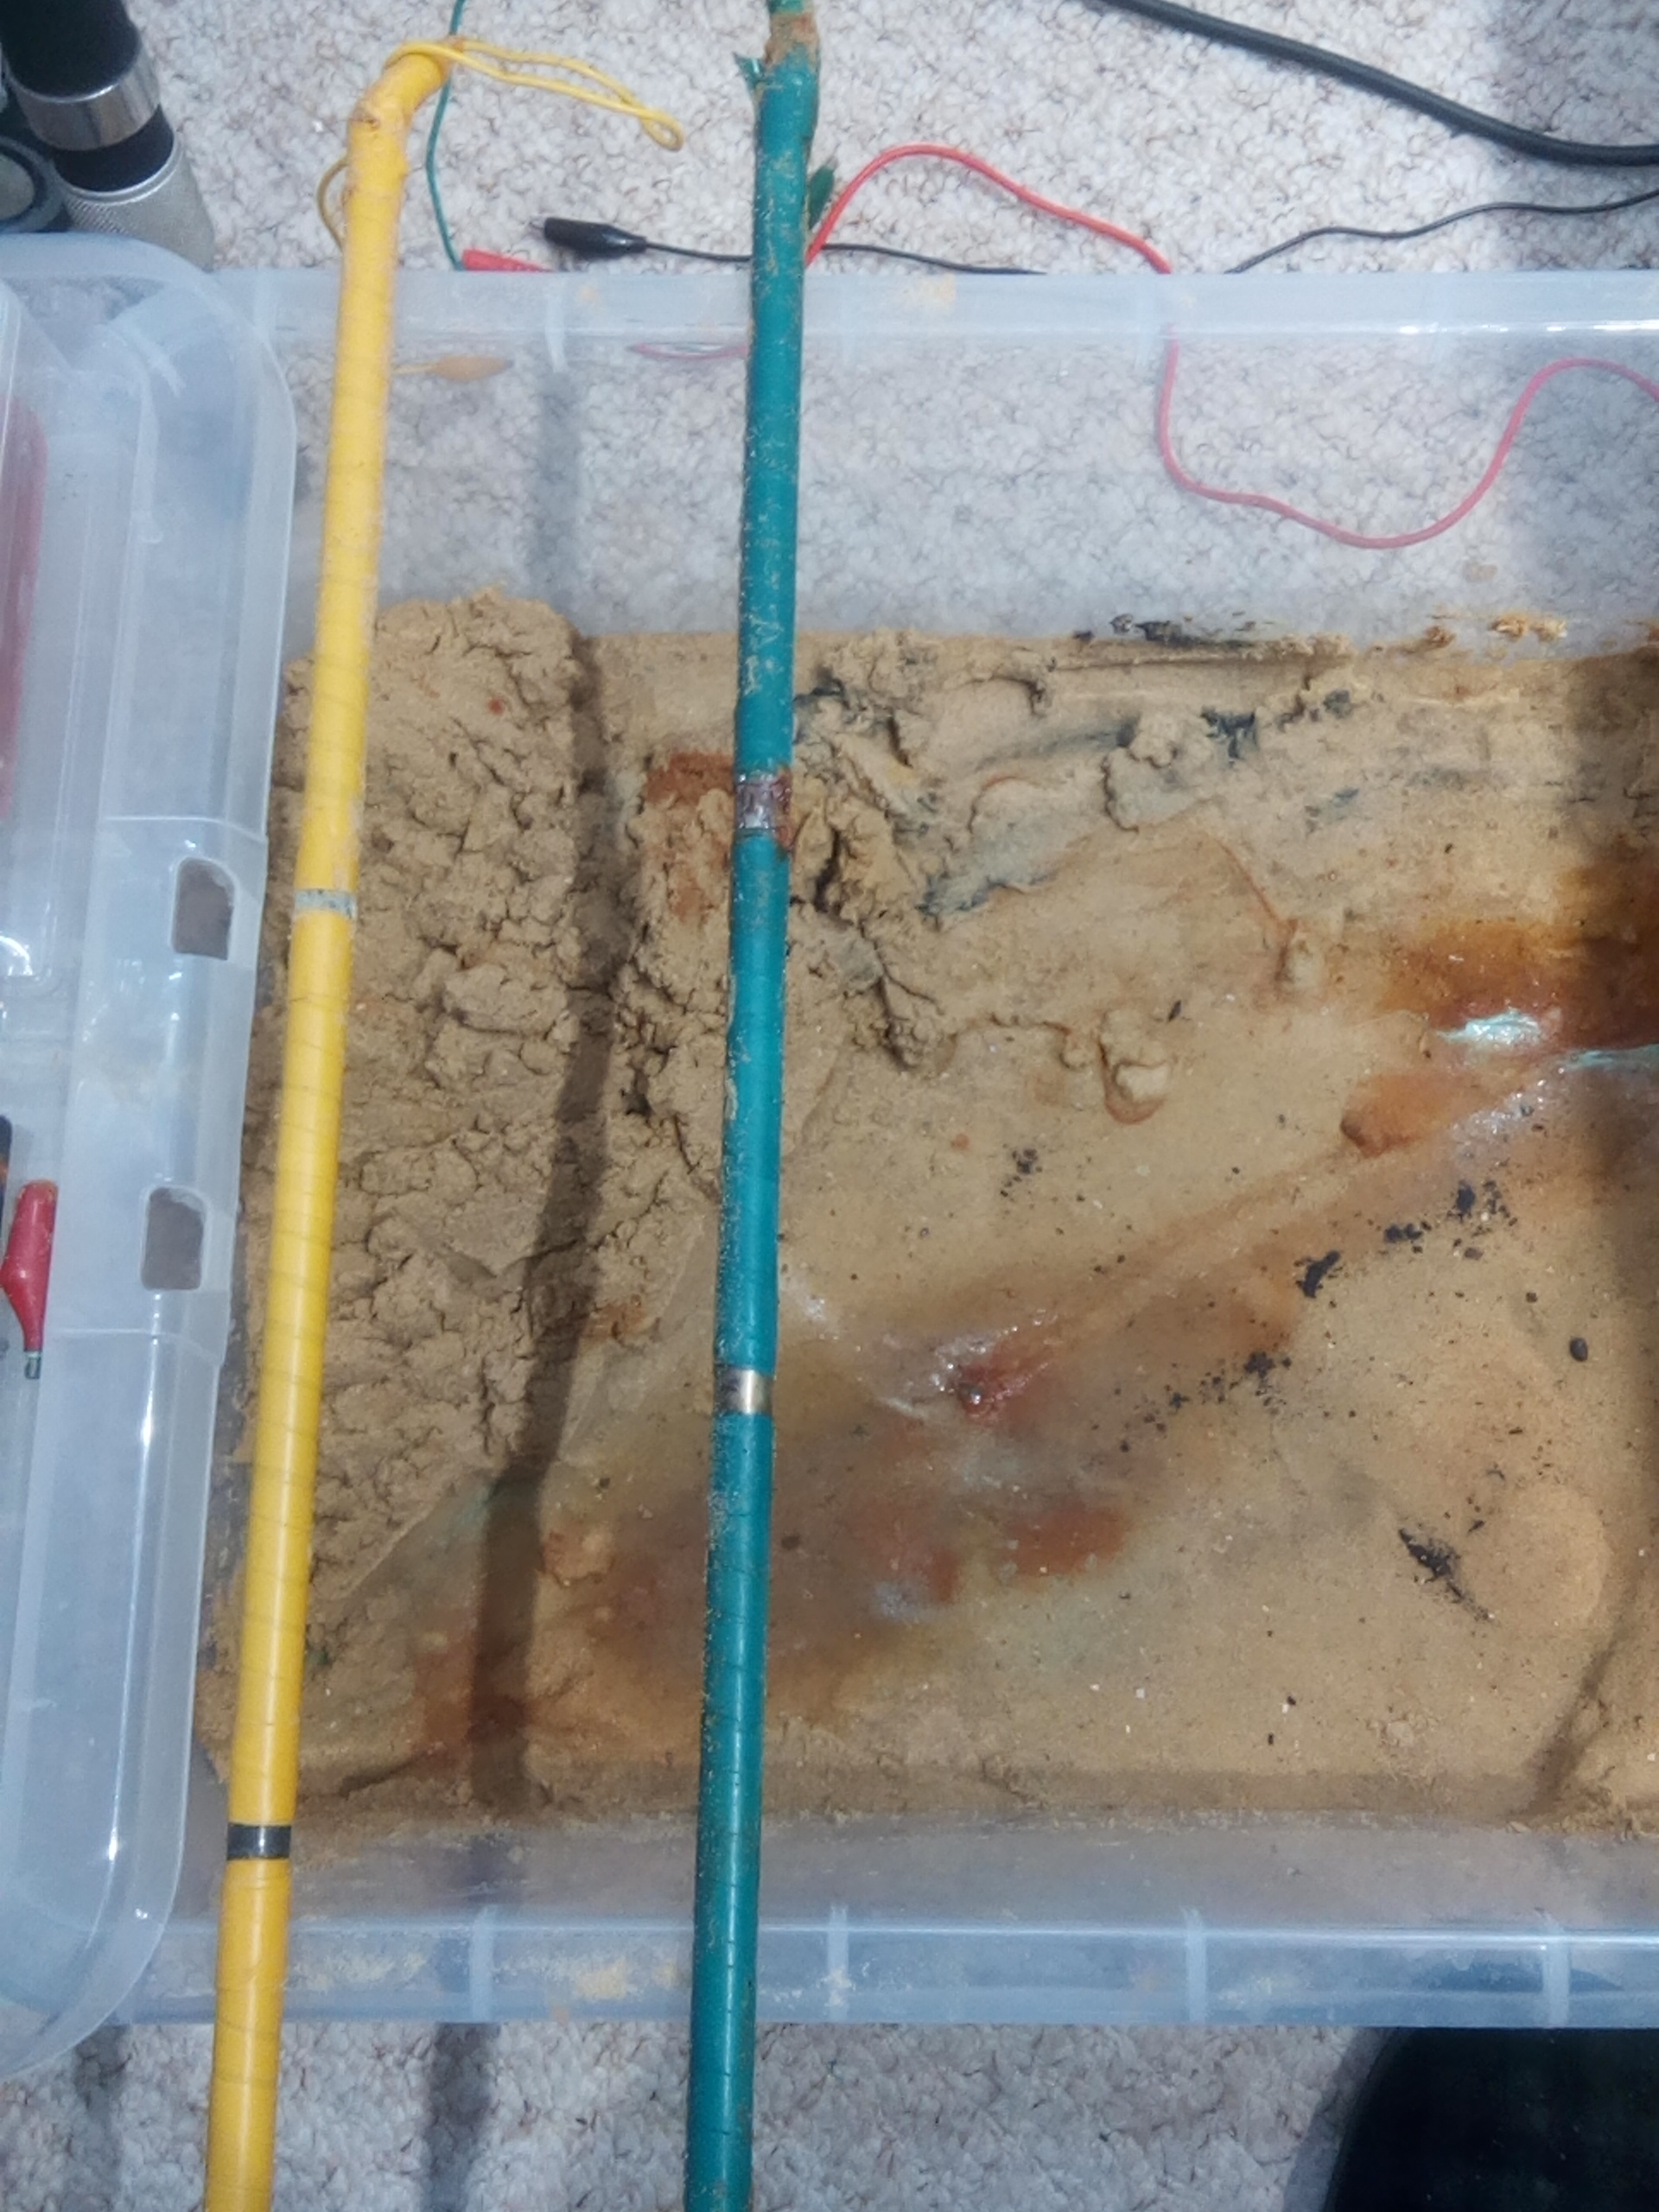
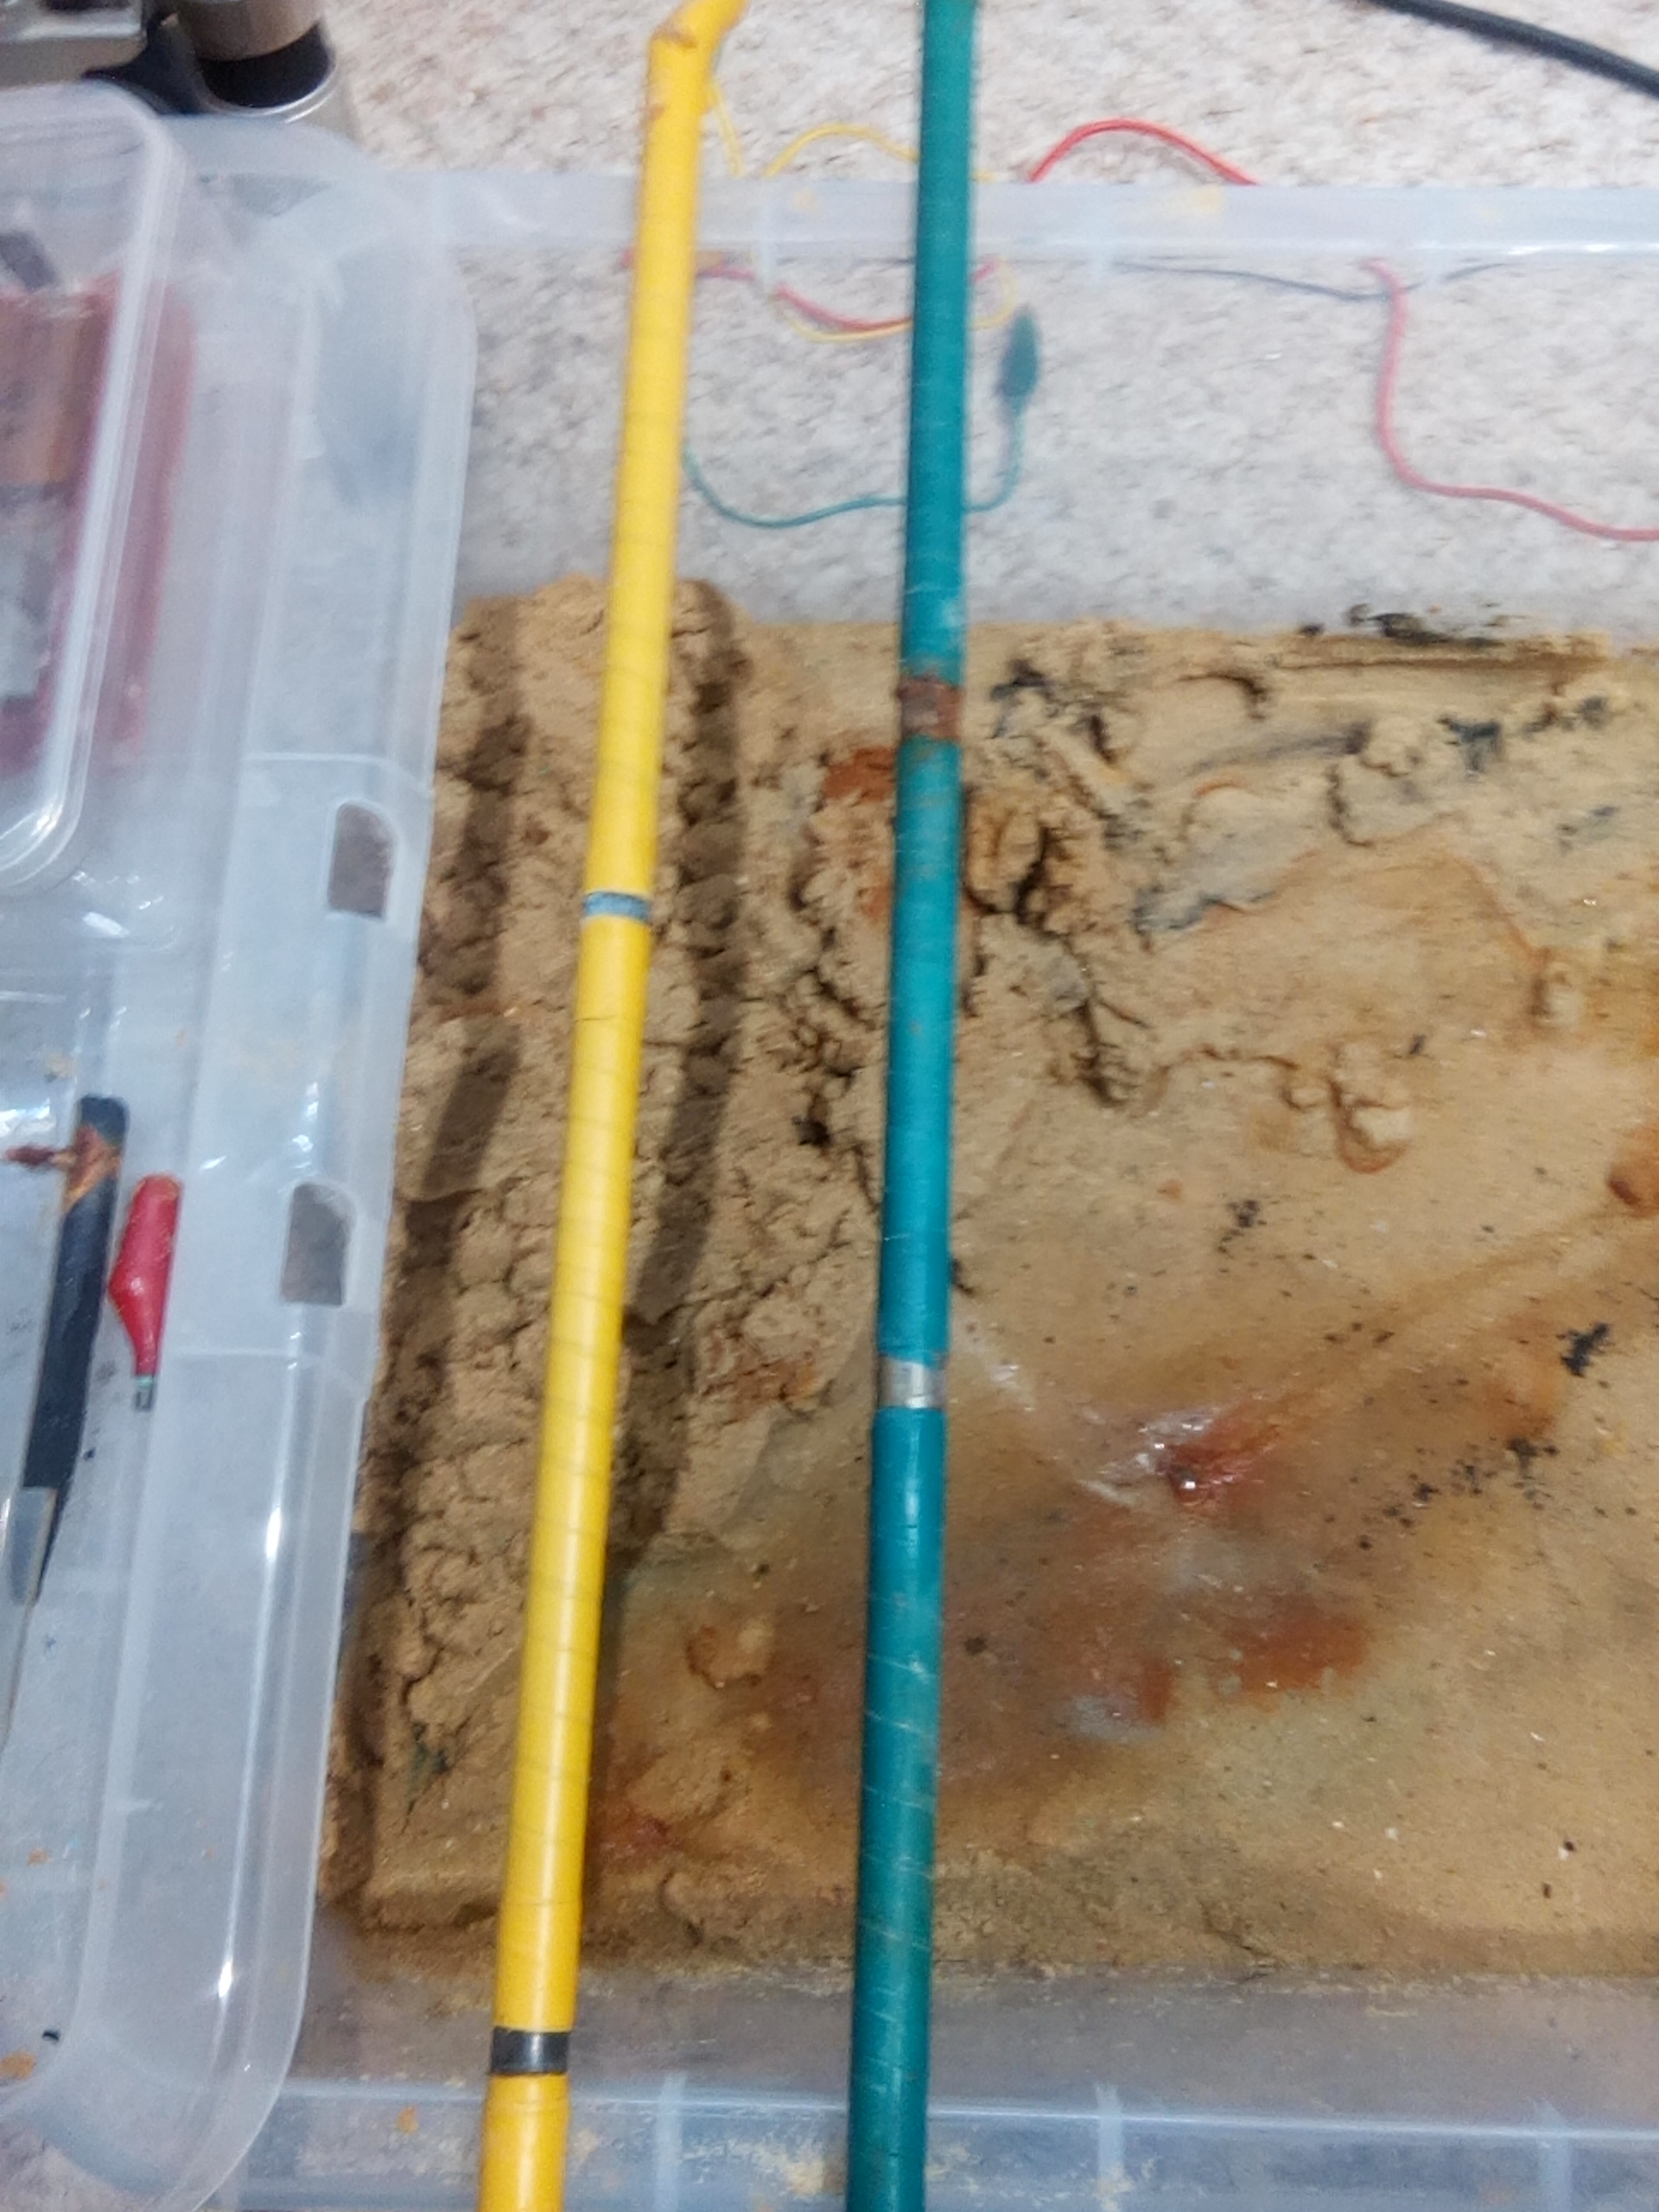
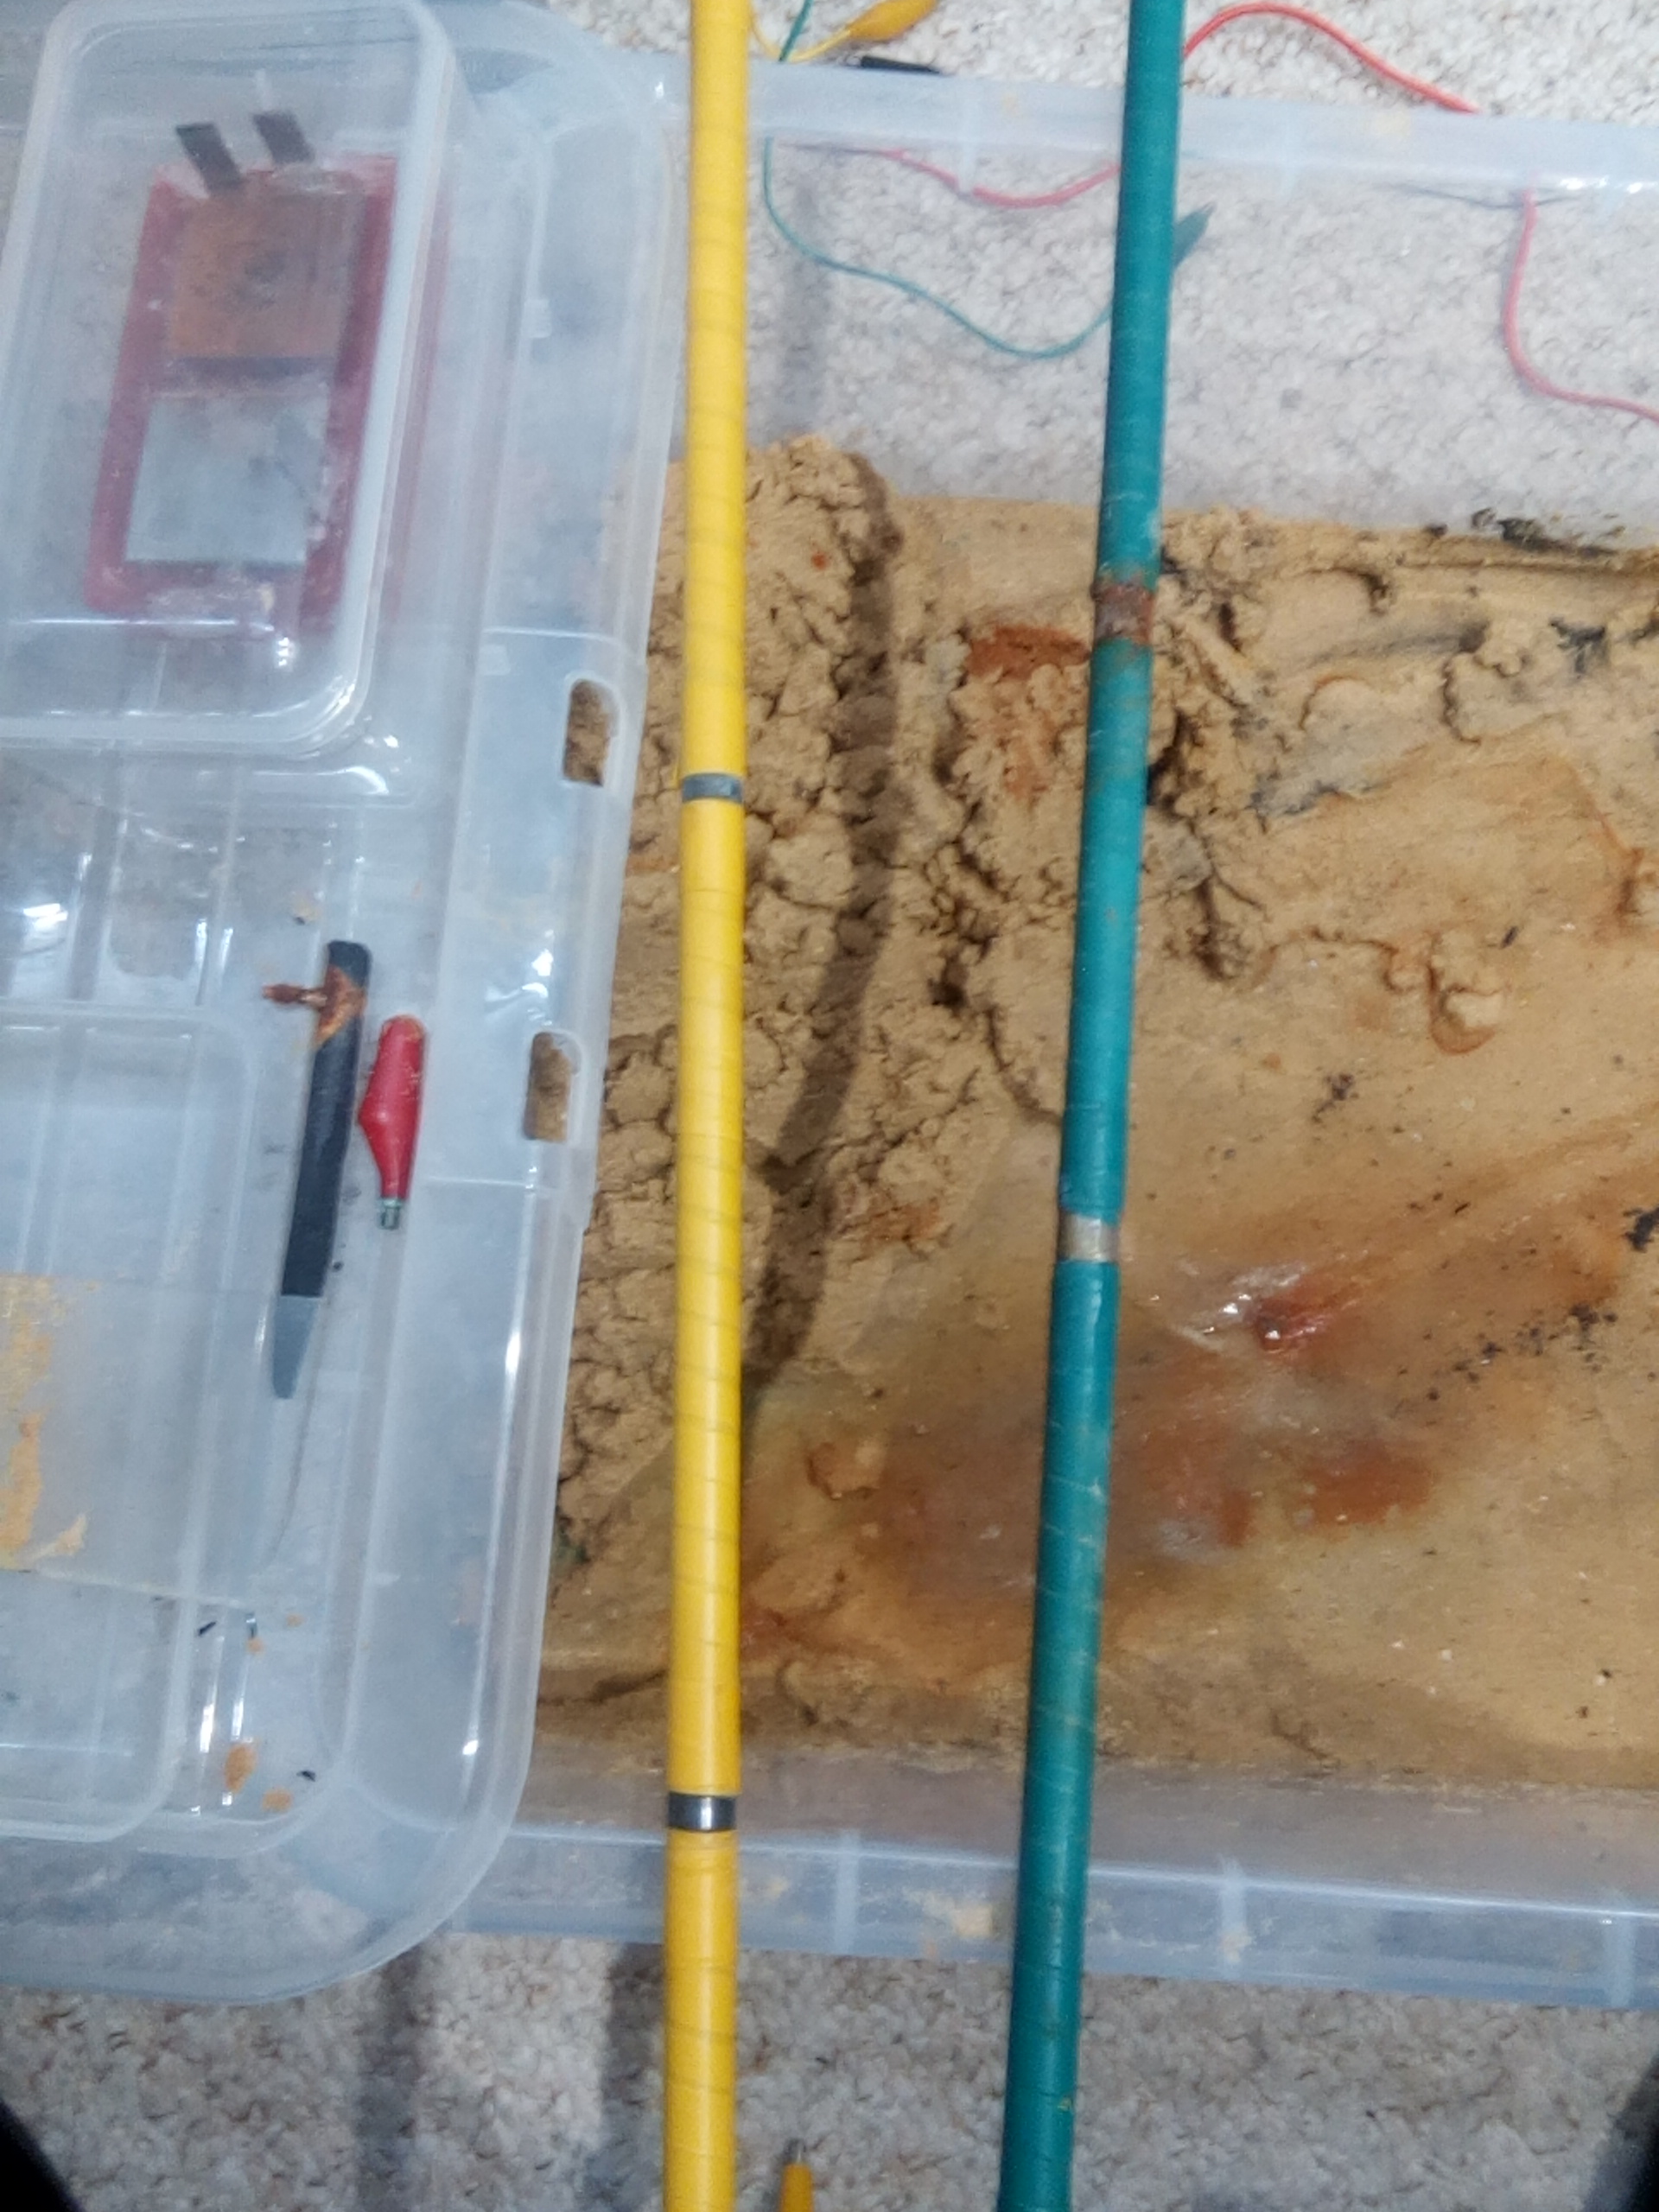
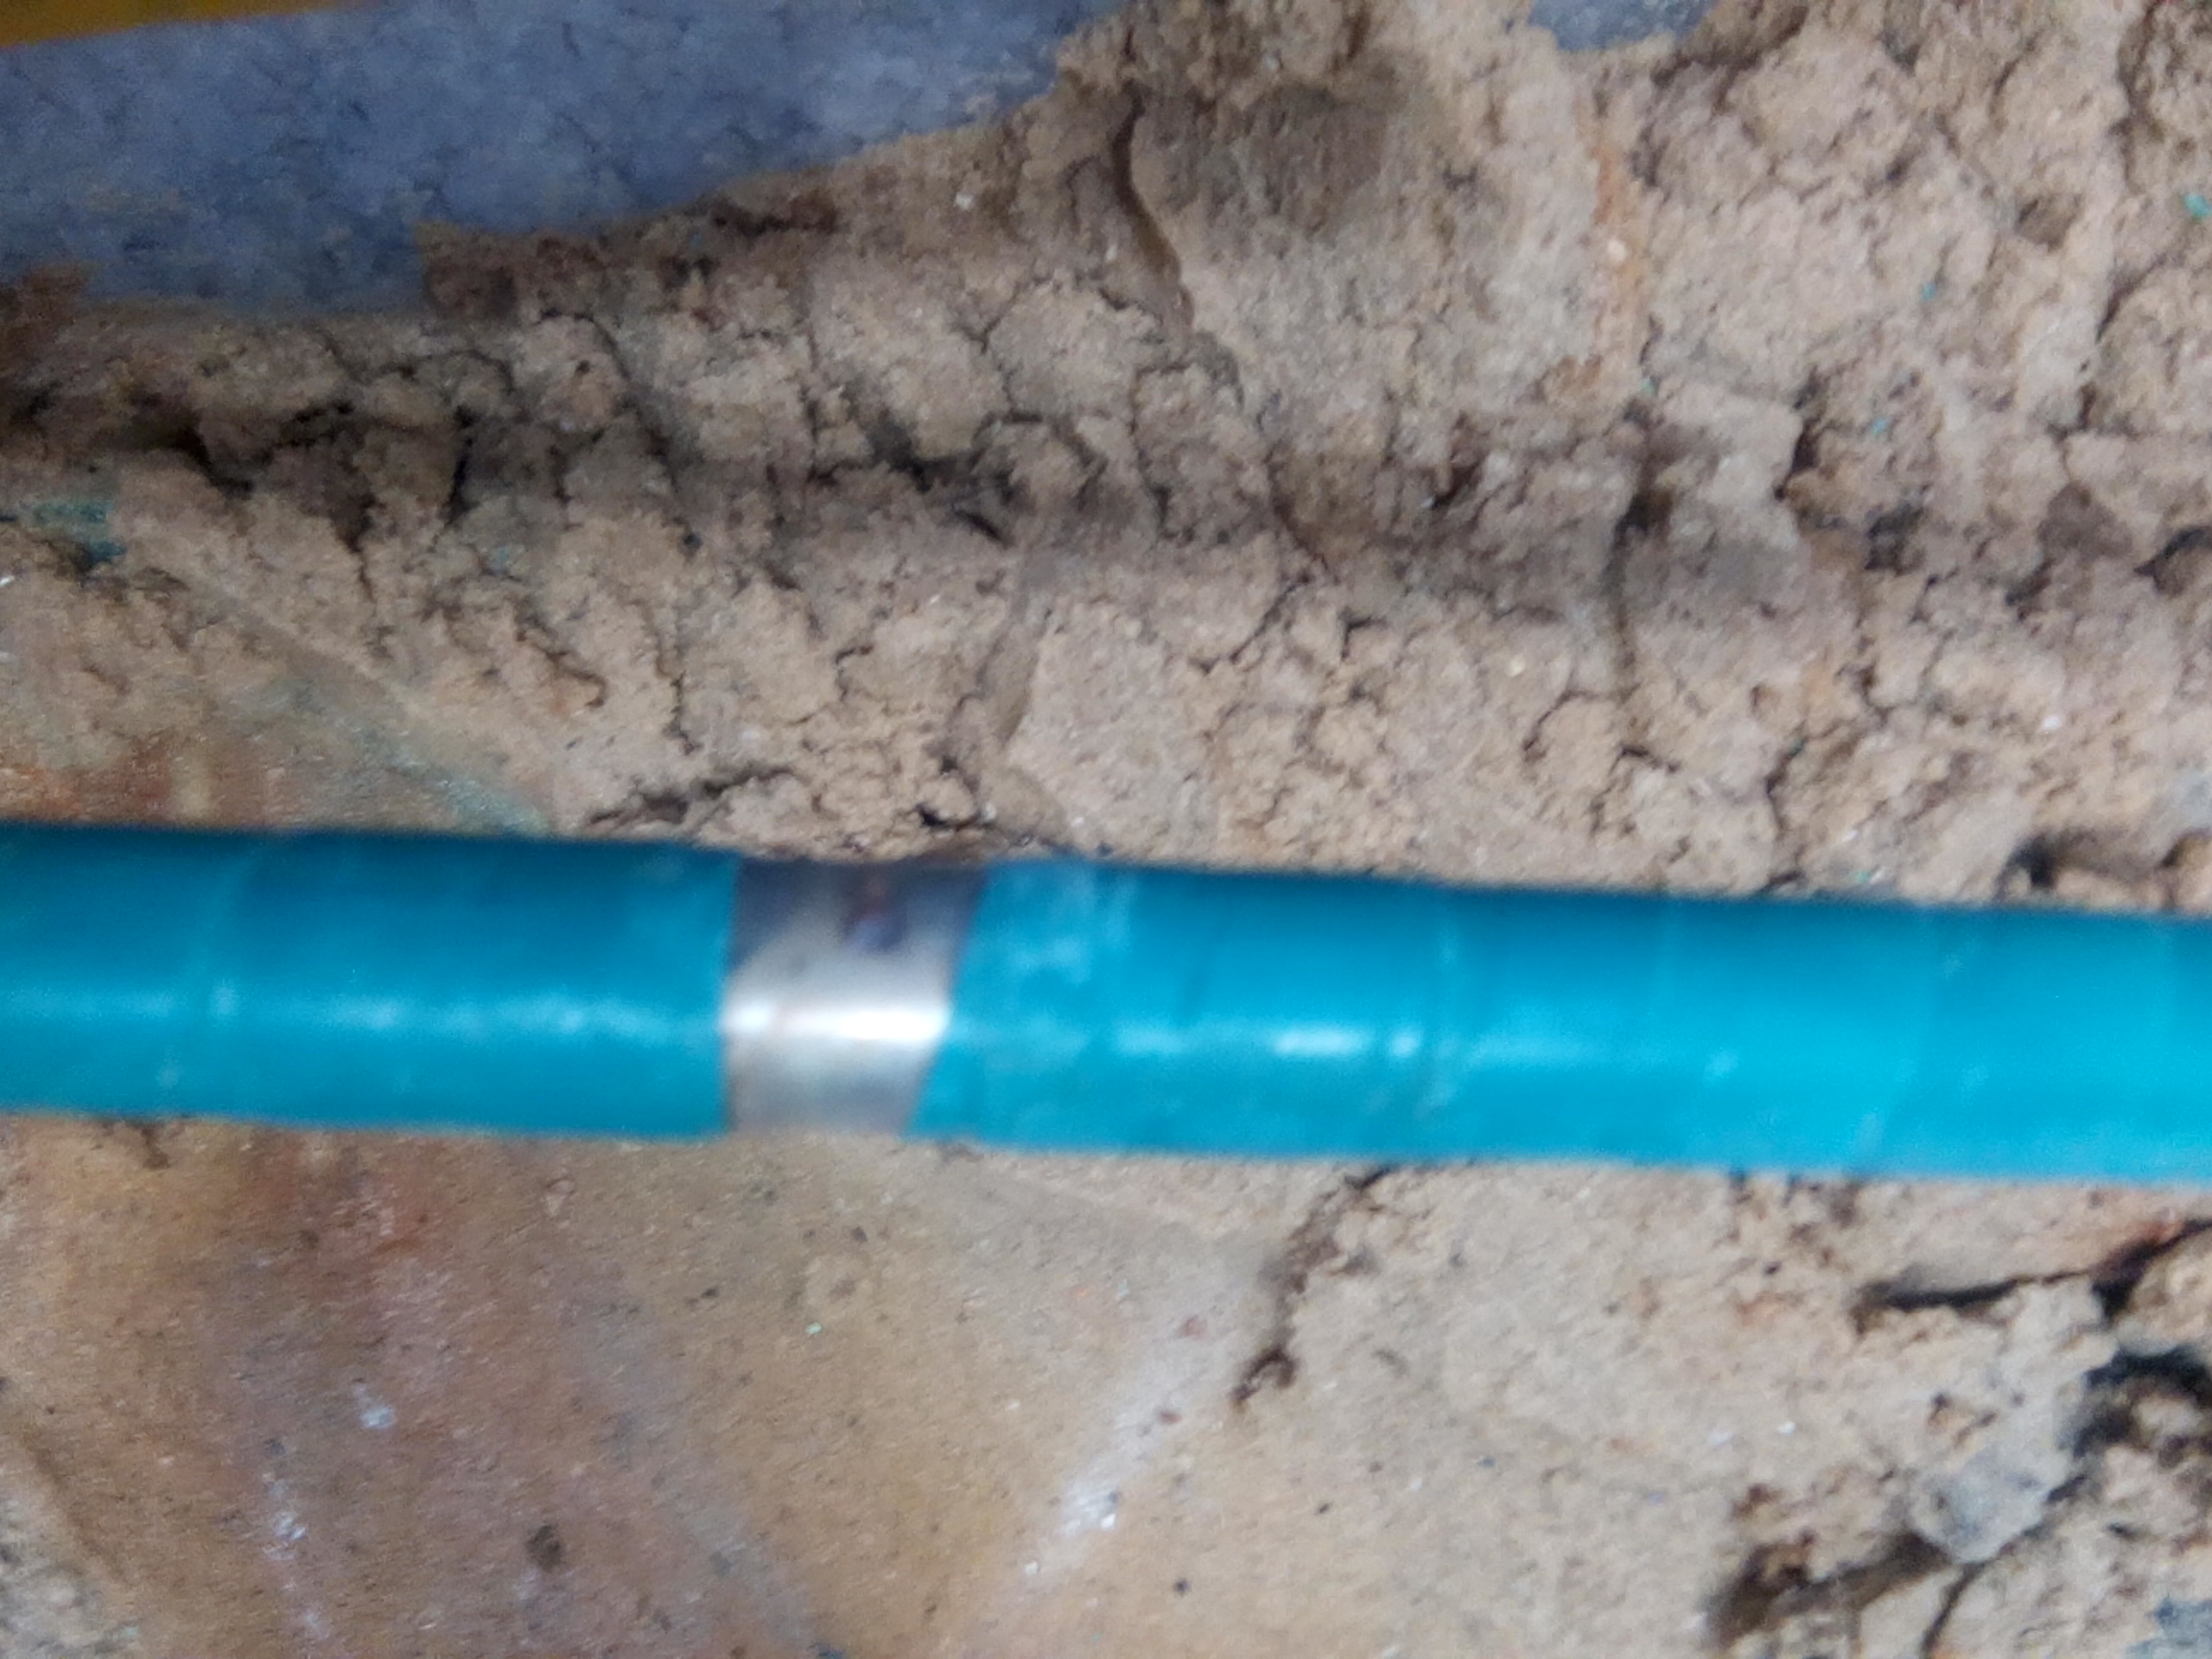
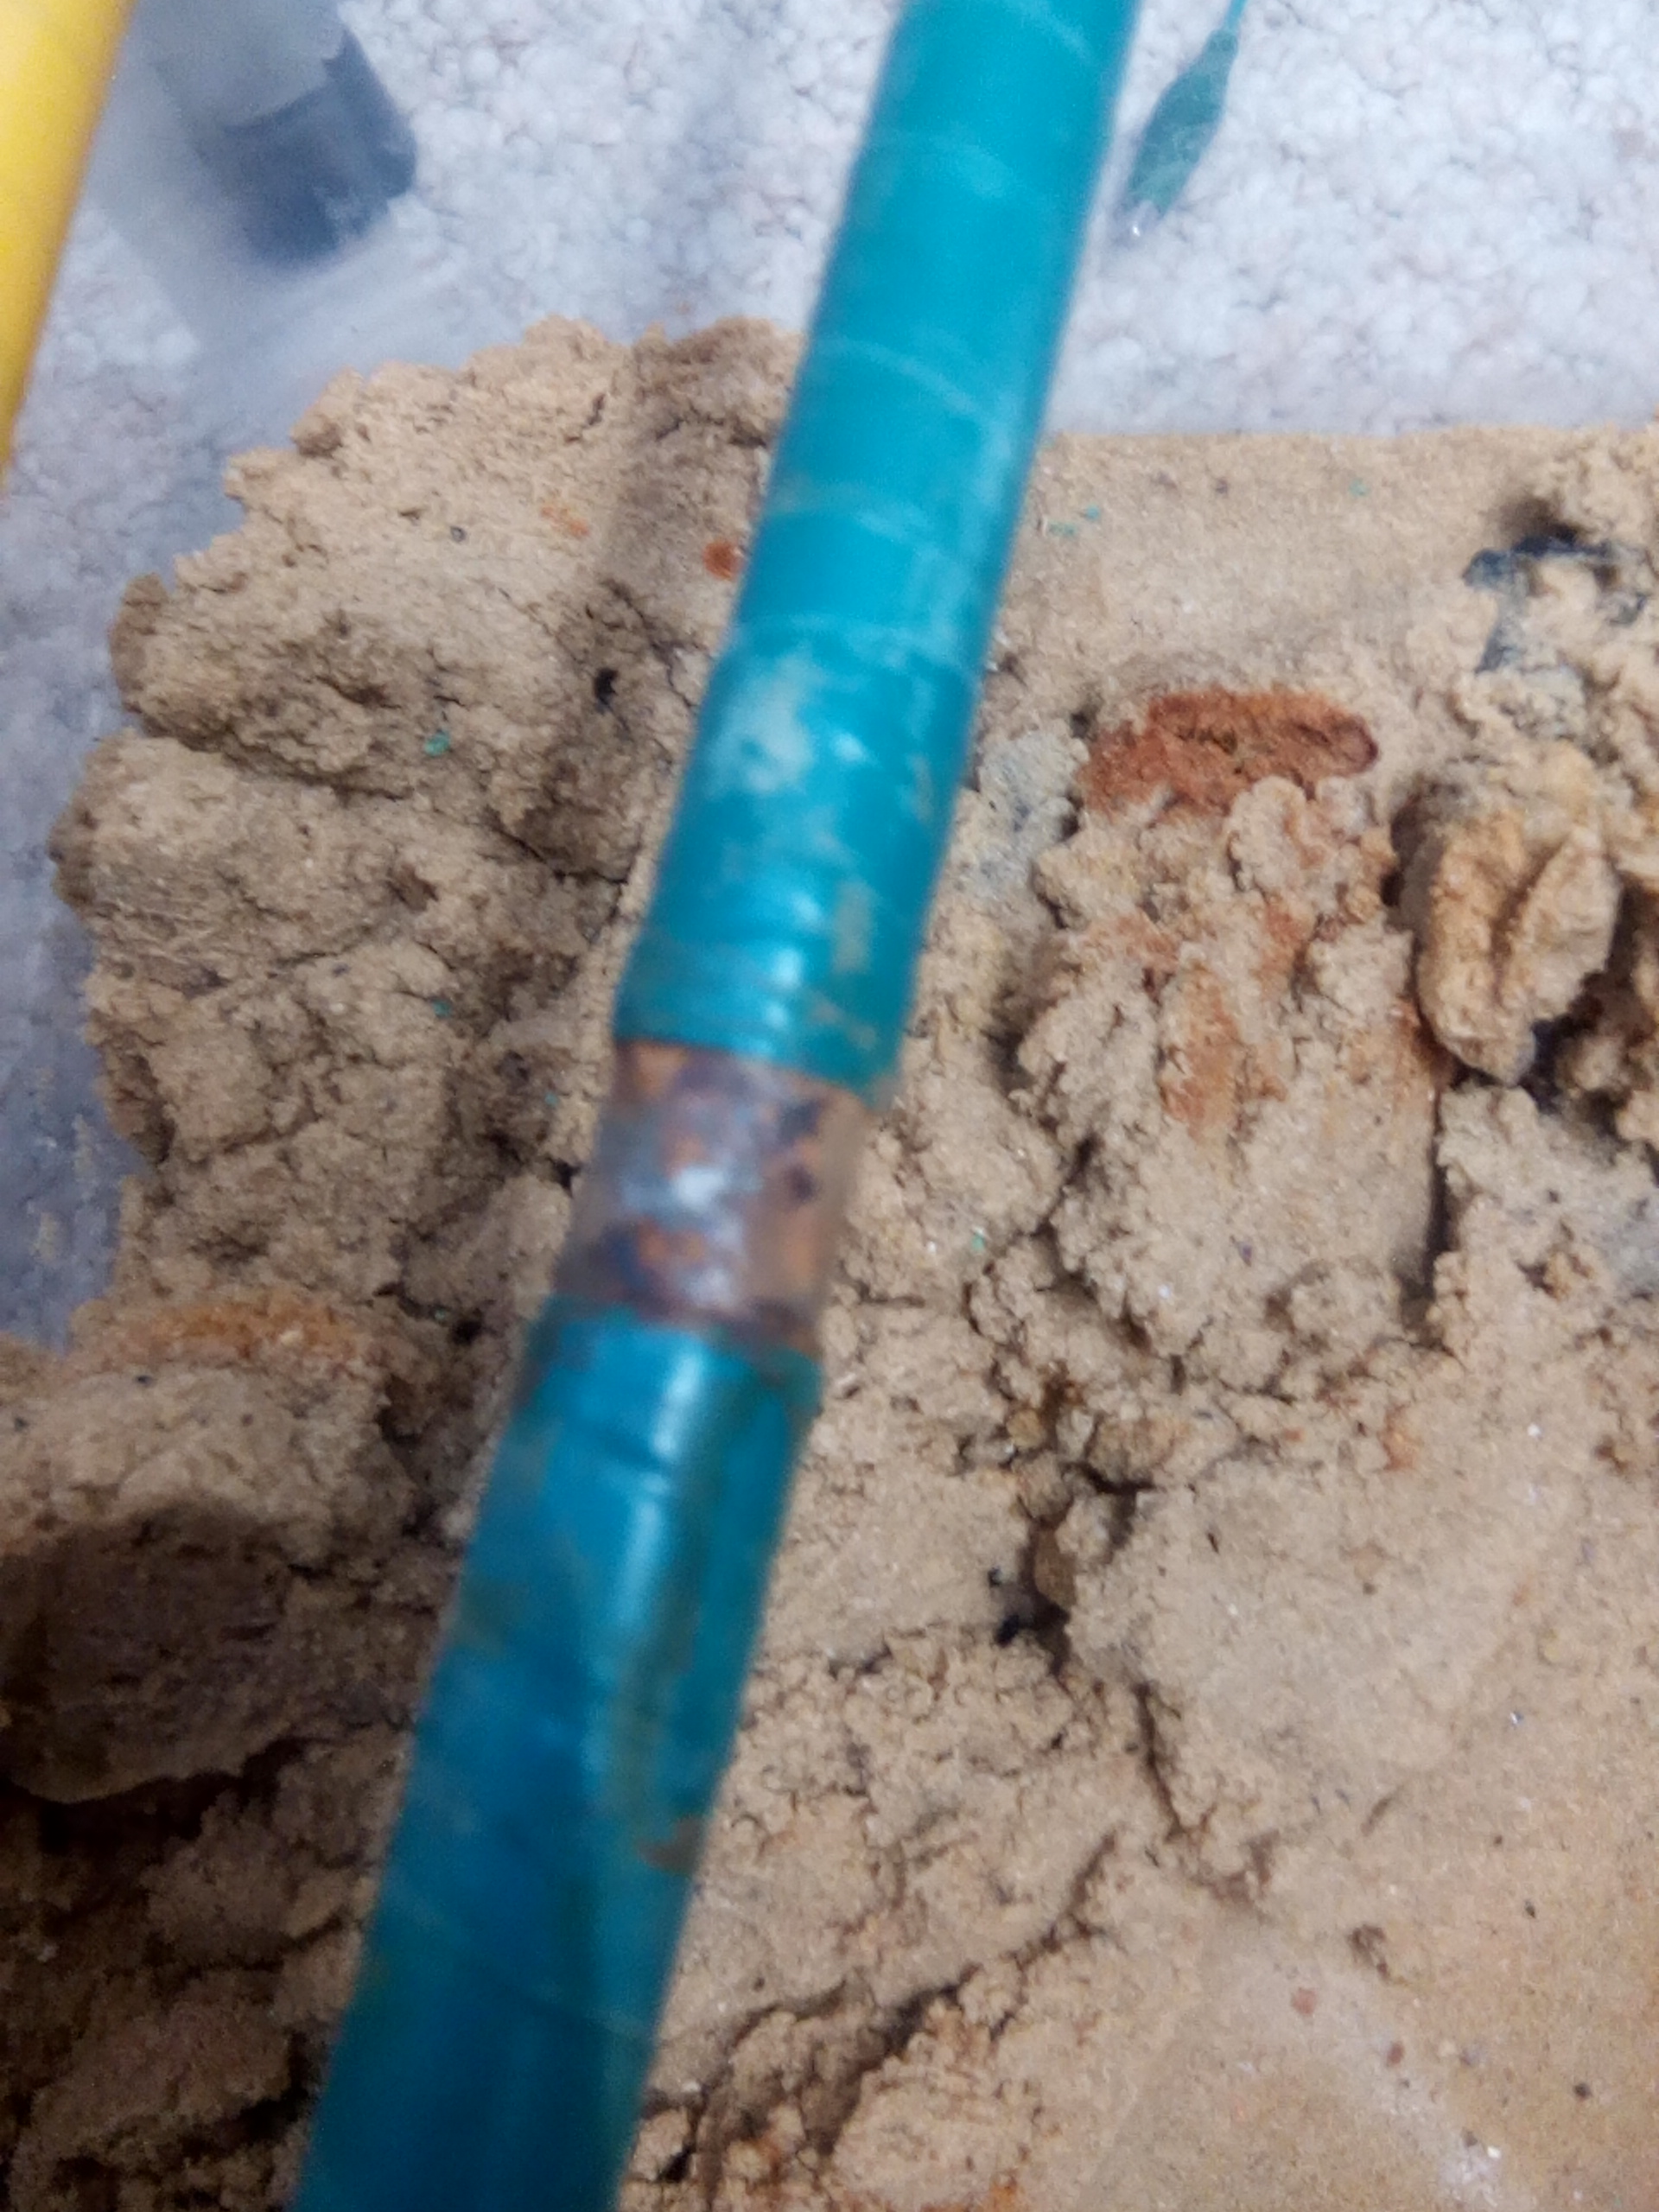
The pipes were coated with electrical insulating tape.
16.
Two gaps were left in the coating of each pipe for alluminium foil to be wrapped round, representing a bracelet anode.
17.
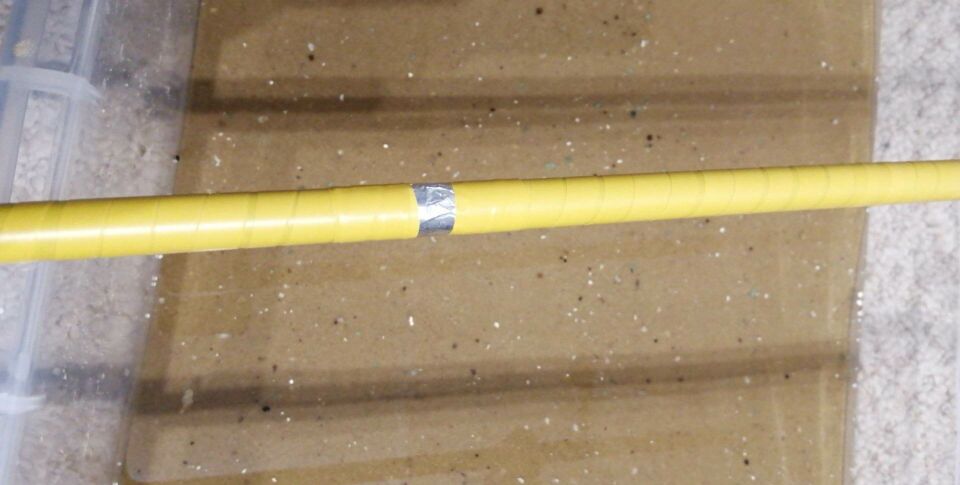
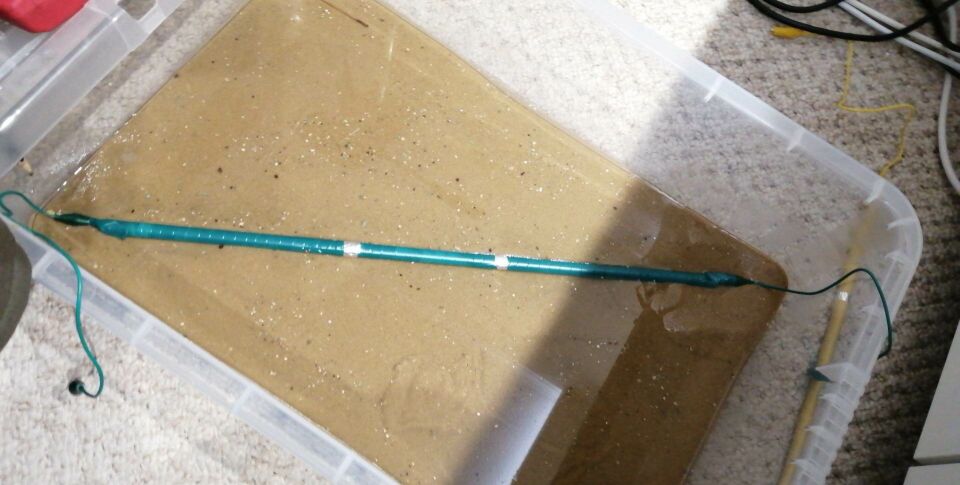
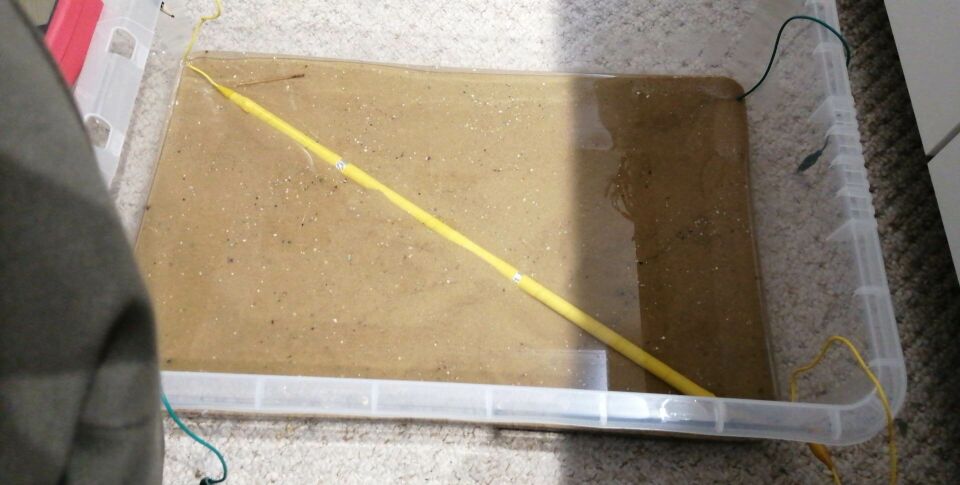
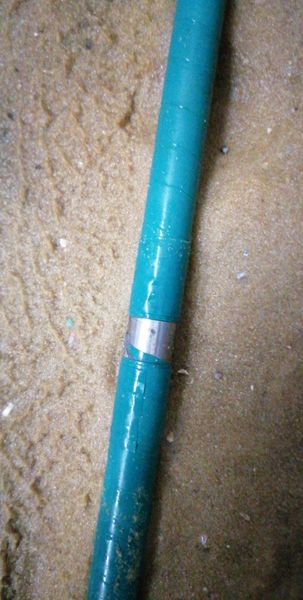
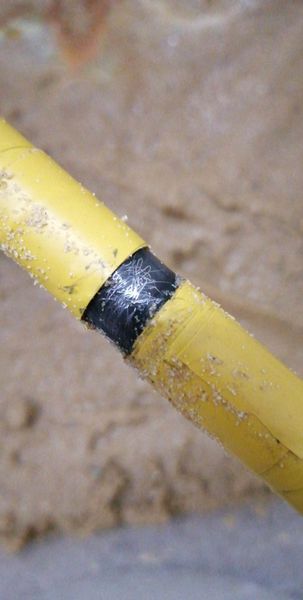
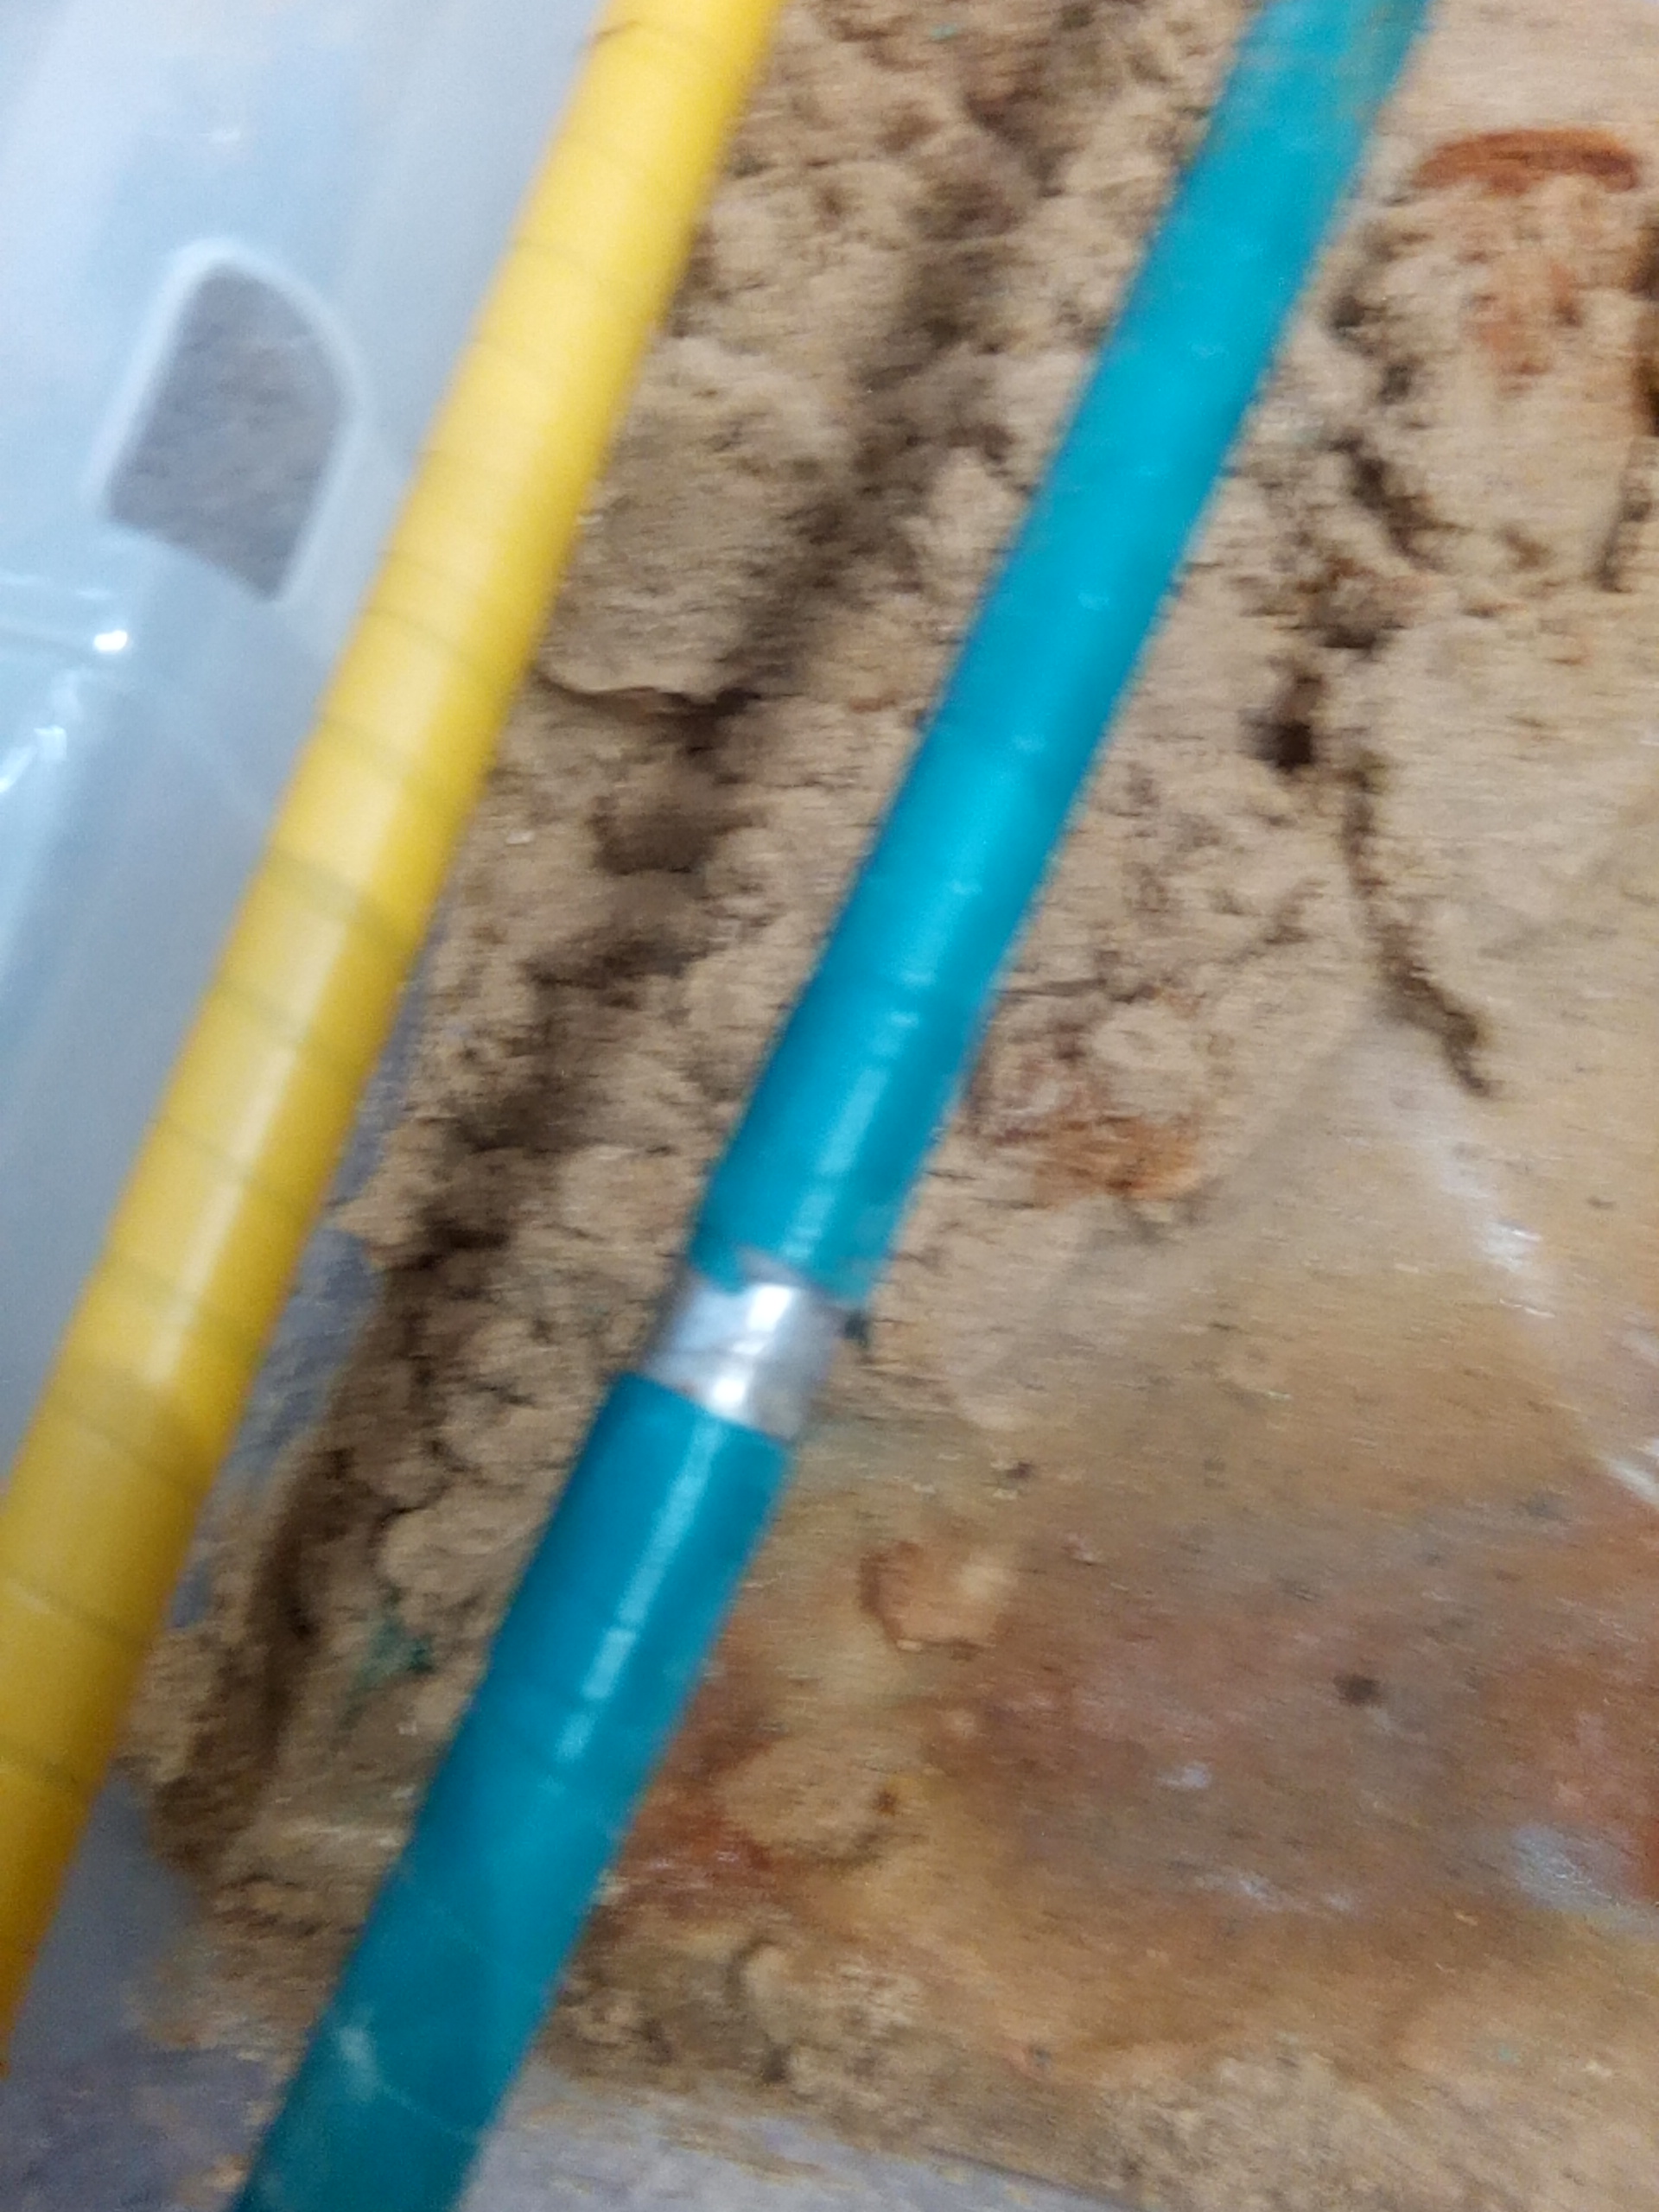
Bracelet anode on yellow pipe.
18.
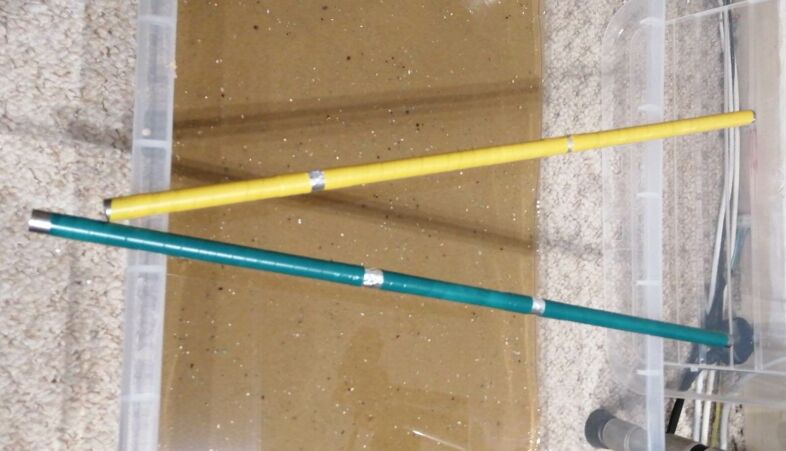
Bracelet anodes on each pipe.
19.

Insulated test lead connections made at each end of each pipe.
20.
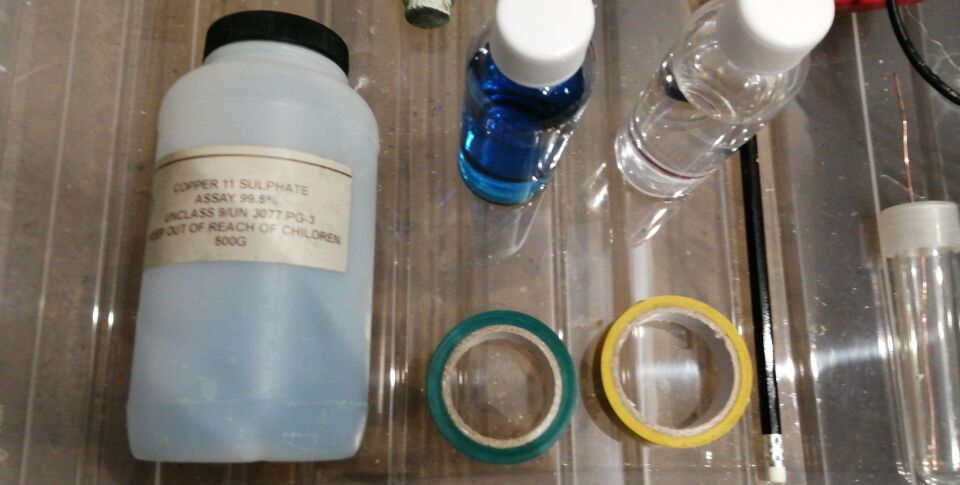
We then gathered the materials to make the CPN half-cells
21.
An HB drawing pencil that has a conductive graphite core, a plastic test tube with screw on lid and a piece of copper wire.
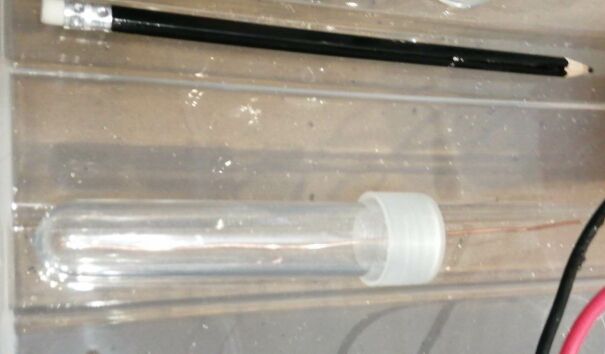
22.
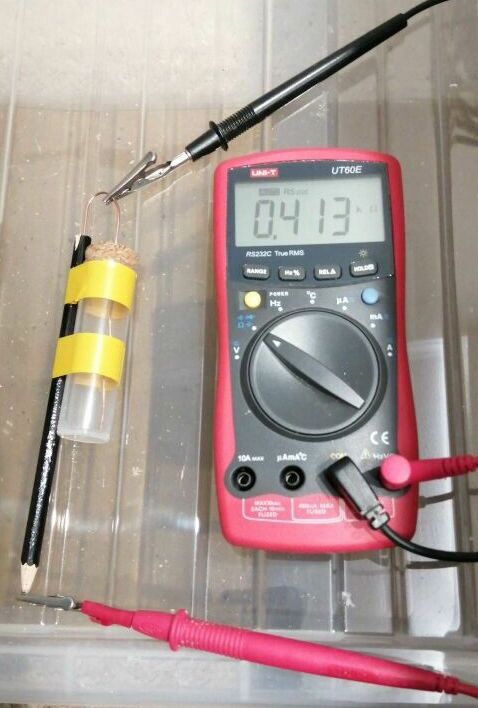
We made the cell as in the picture and tested for continuity seeing that the circuit resistance was 0.423 kOhms.
23.
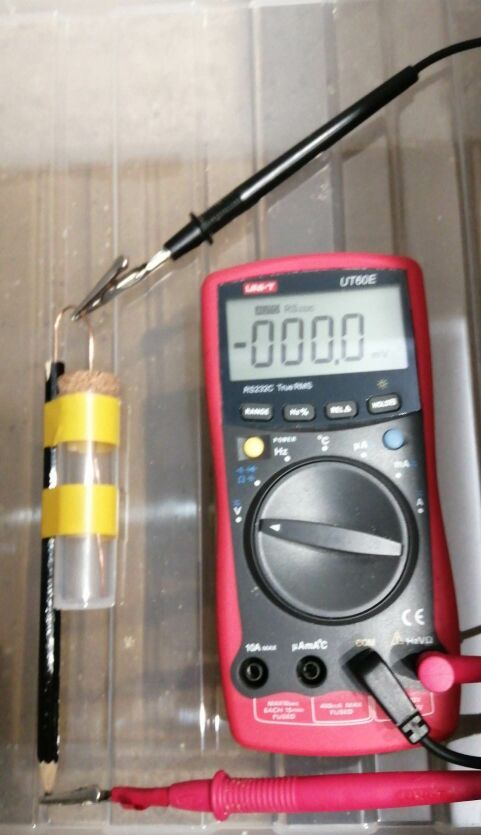
We set the multimeter on volts and there was none.
24.
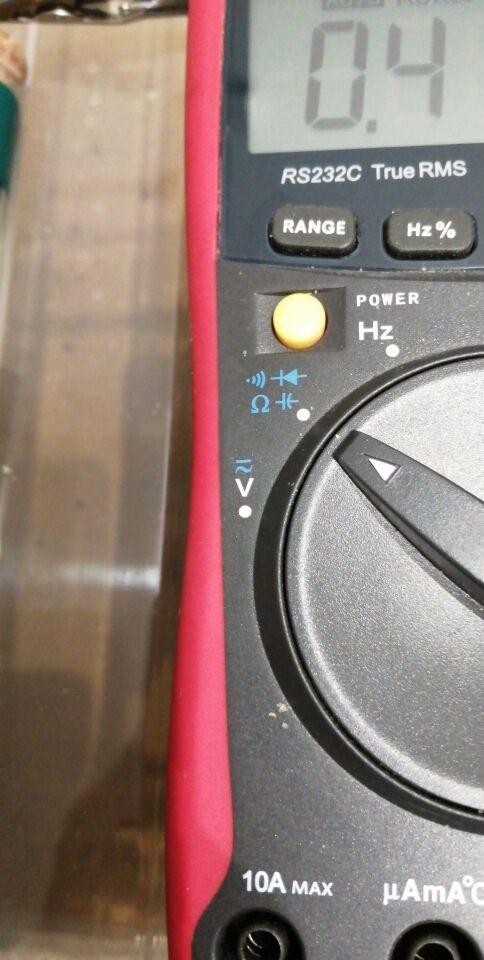
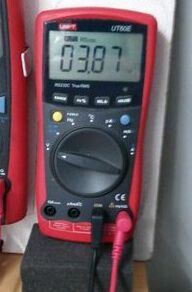
Shows the meter setting.
25.
418 Ohms circuit resistance.
26.
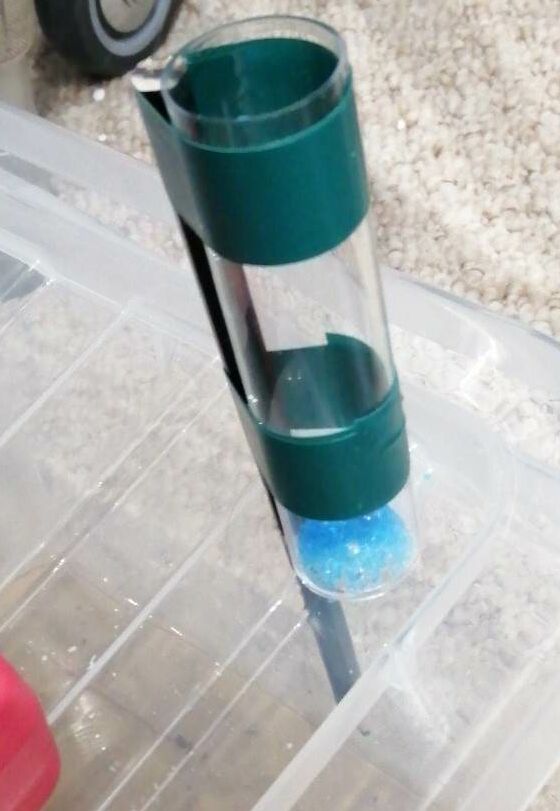
CPN half-cell with copper sulphate crystals
27.
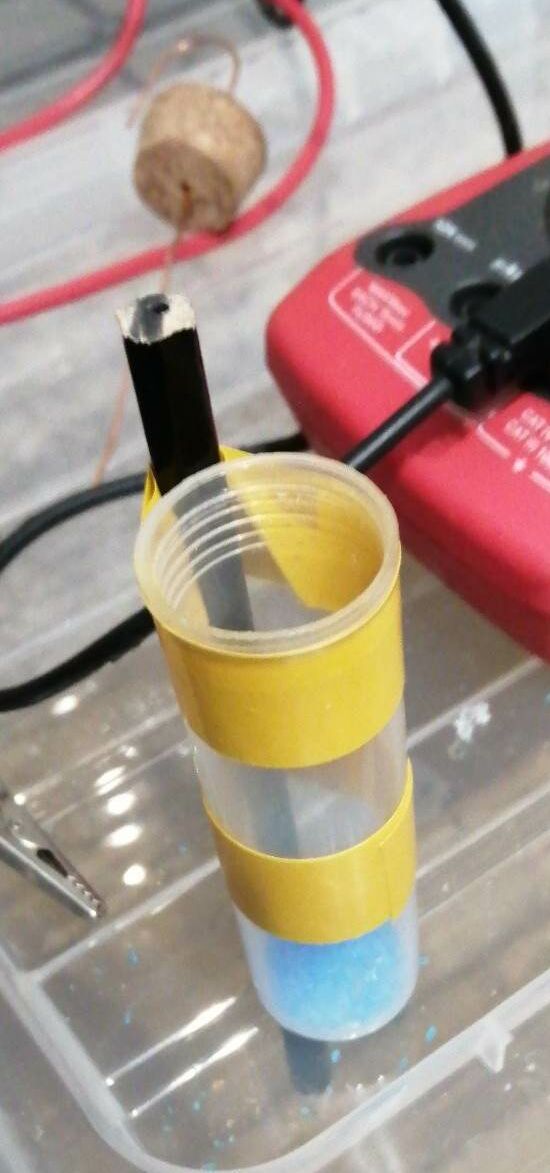
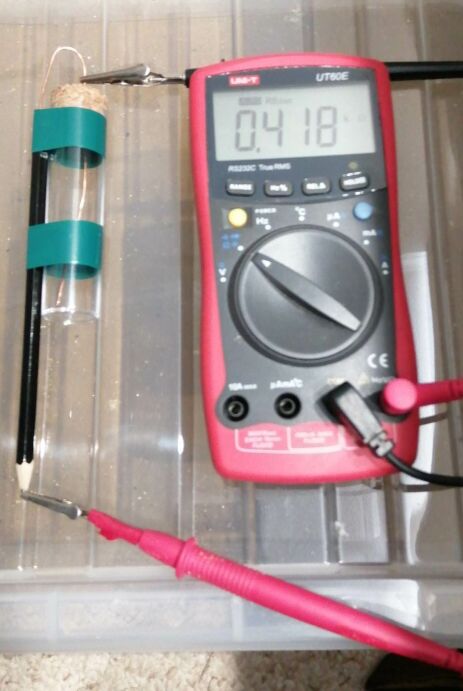
Yellow taped CPN half-cell with copper sulphate crystals.
28.
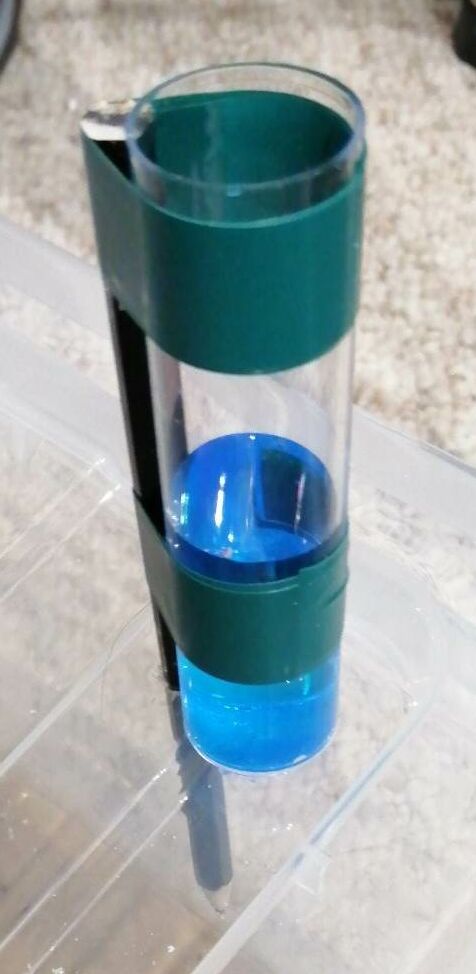
Green taped CPN half-cell with saturated solution of copper sulphate.
29.
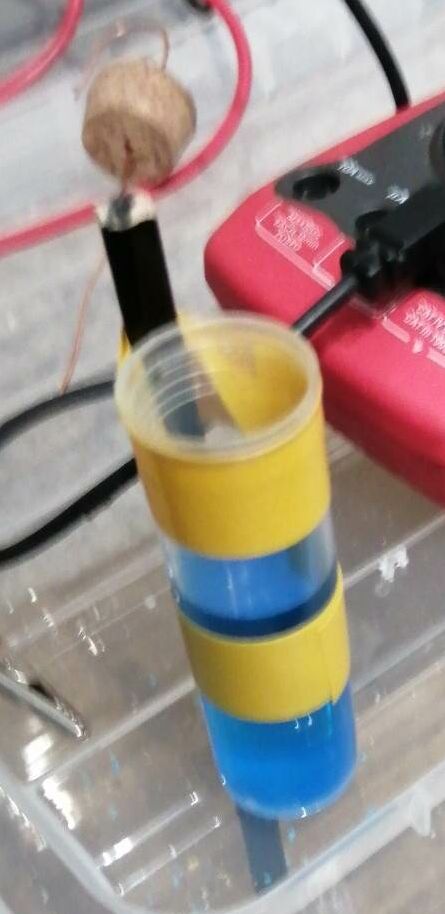
Yellow taped CPN half-cell with saturated solution of copper sulphate.
30.
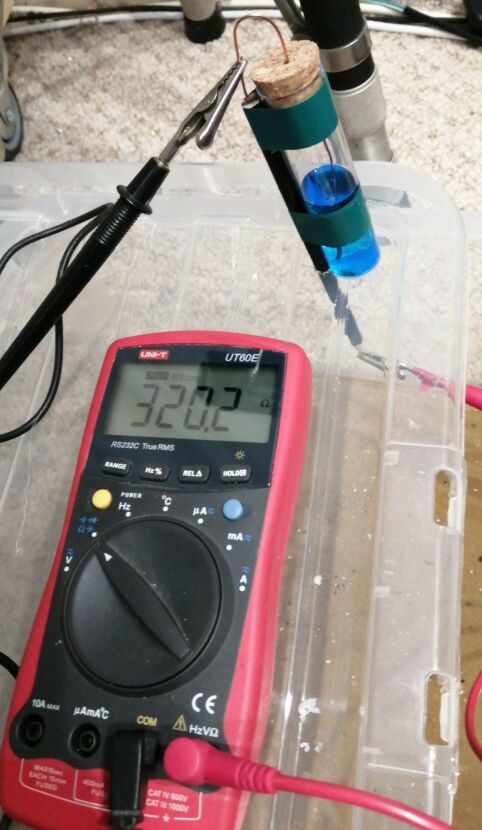
Circuit resistance of green taped CPN half-cell is 320.2 Ohms.
31.
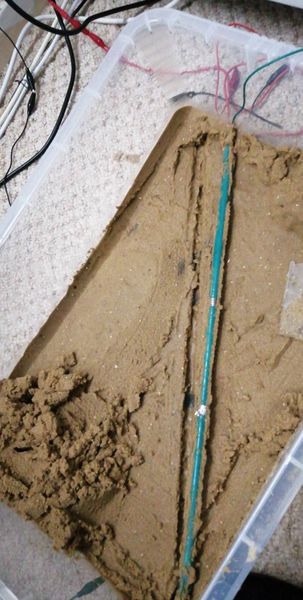
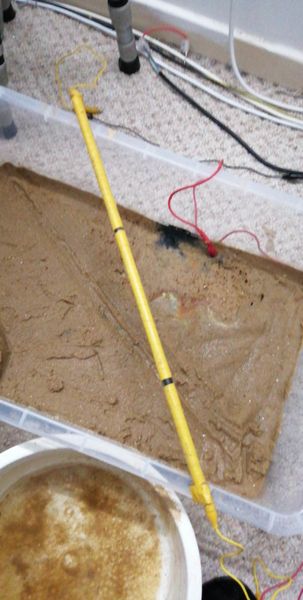
Green taped pipe placed in position on the bottom of the plastic continer and sandy water
32.
Green taped pipe covered with sand with test leads flopped over the sides of the plastic container.
33.
Yellow taped pipe placed across the green taped pipe with test leads flopped over the sides of the container.
34.
Yellow taped pipe covered with sandy waterin the same manner as a submarine pipeline crossing.
35.
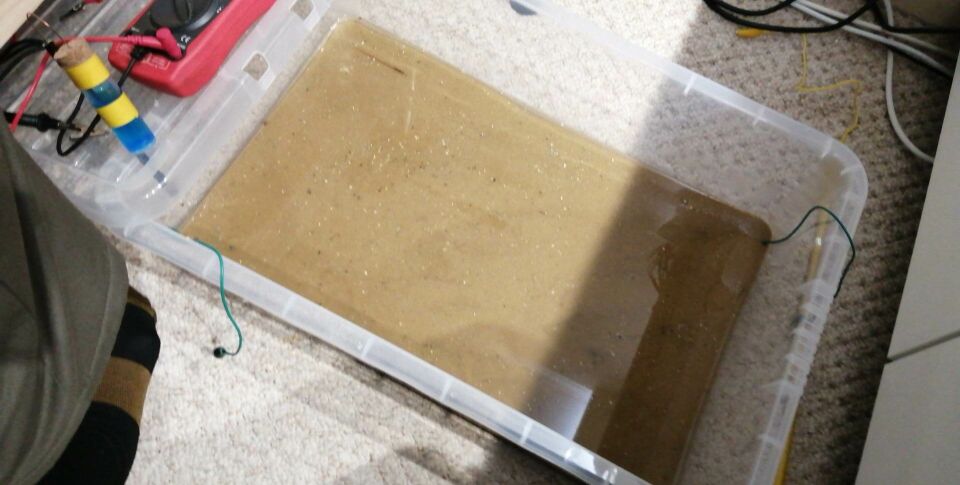
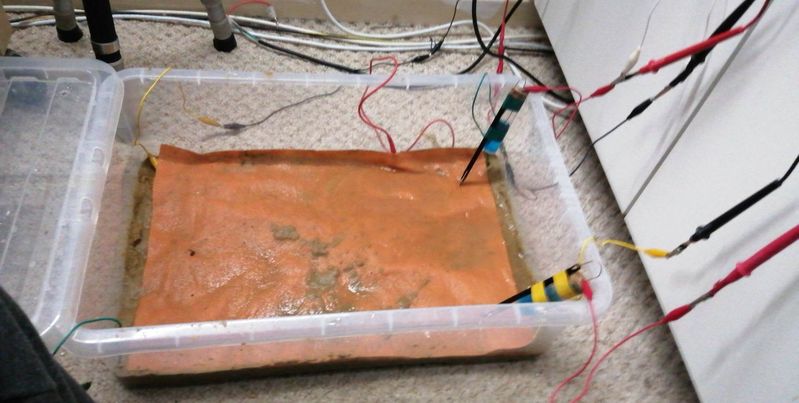
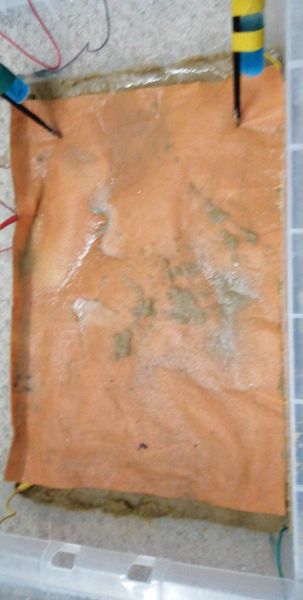
A super-absorbant cloth laid over the sand to represent sediment on the ocean bed above the buried pipelines.
36.
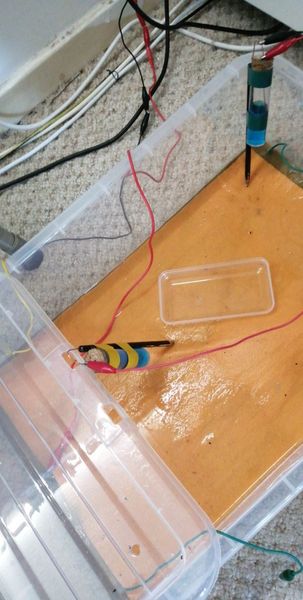
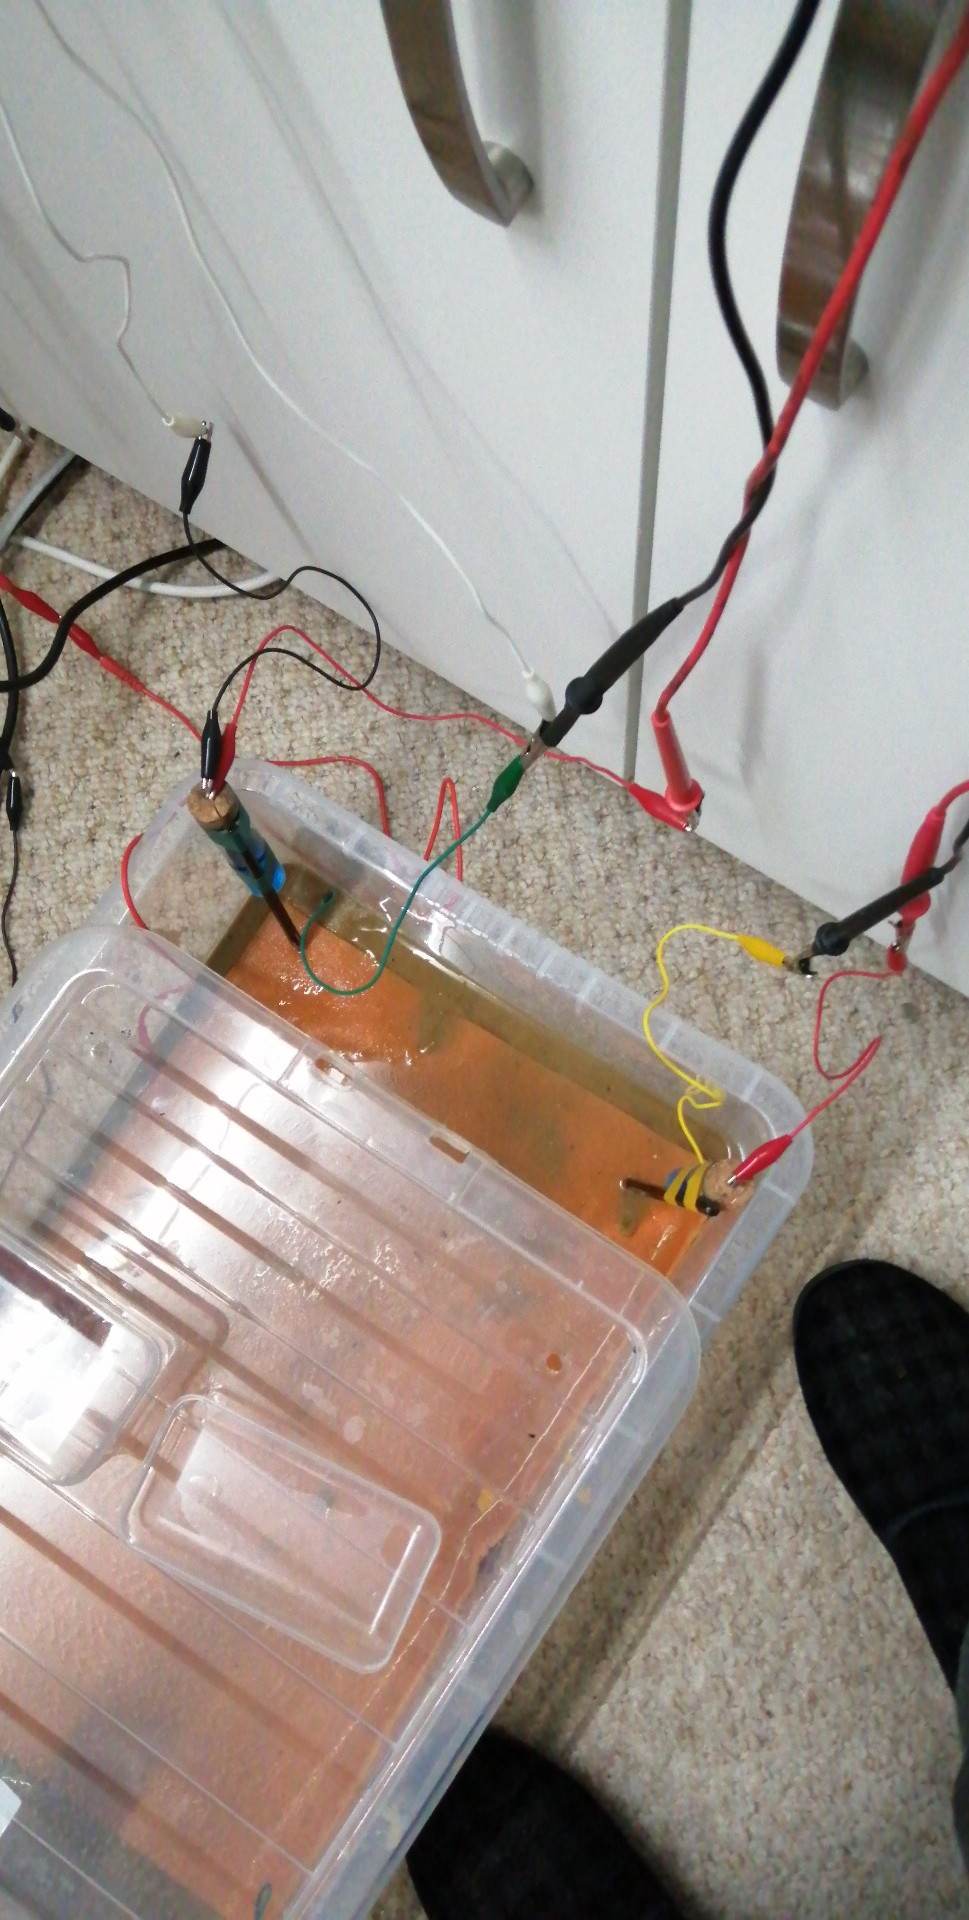
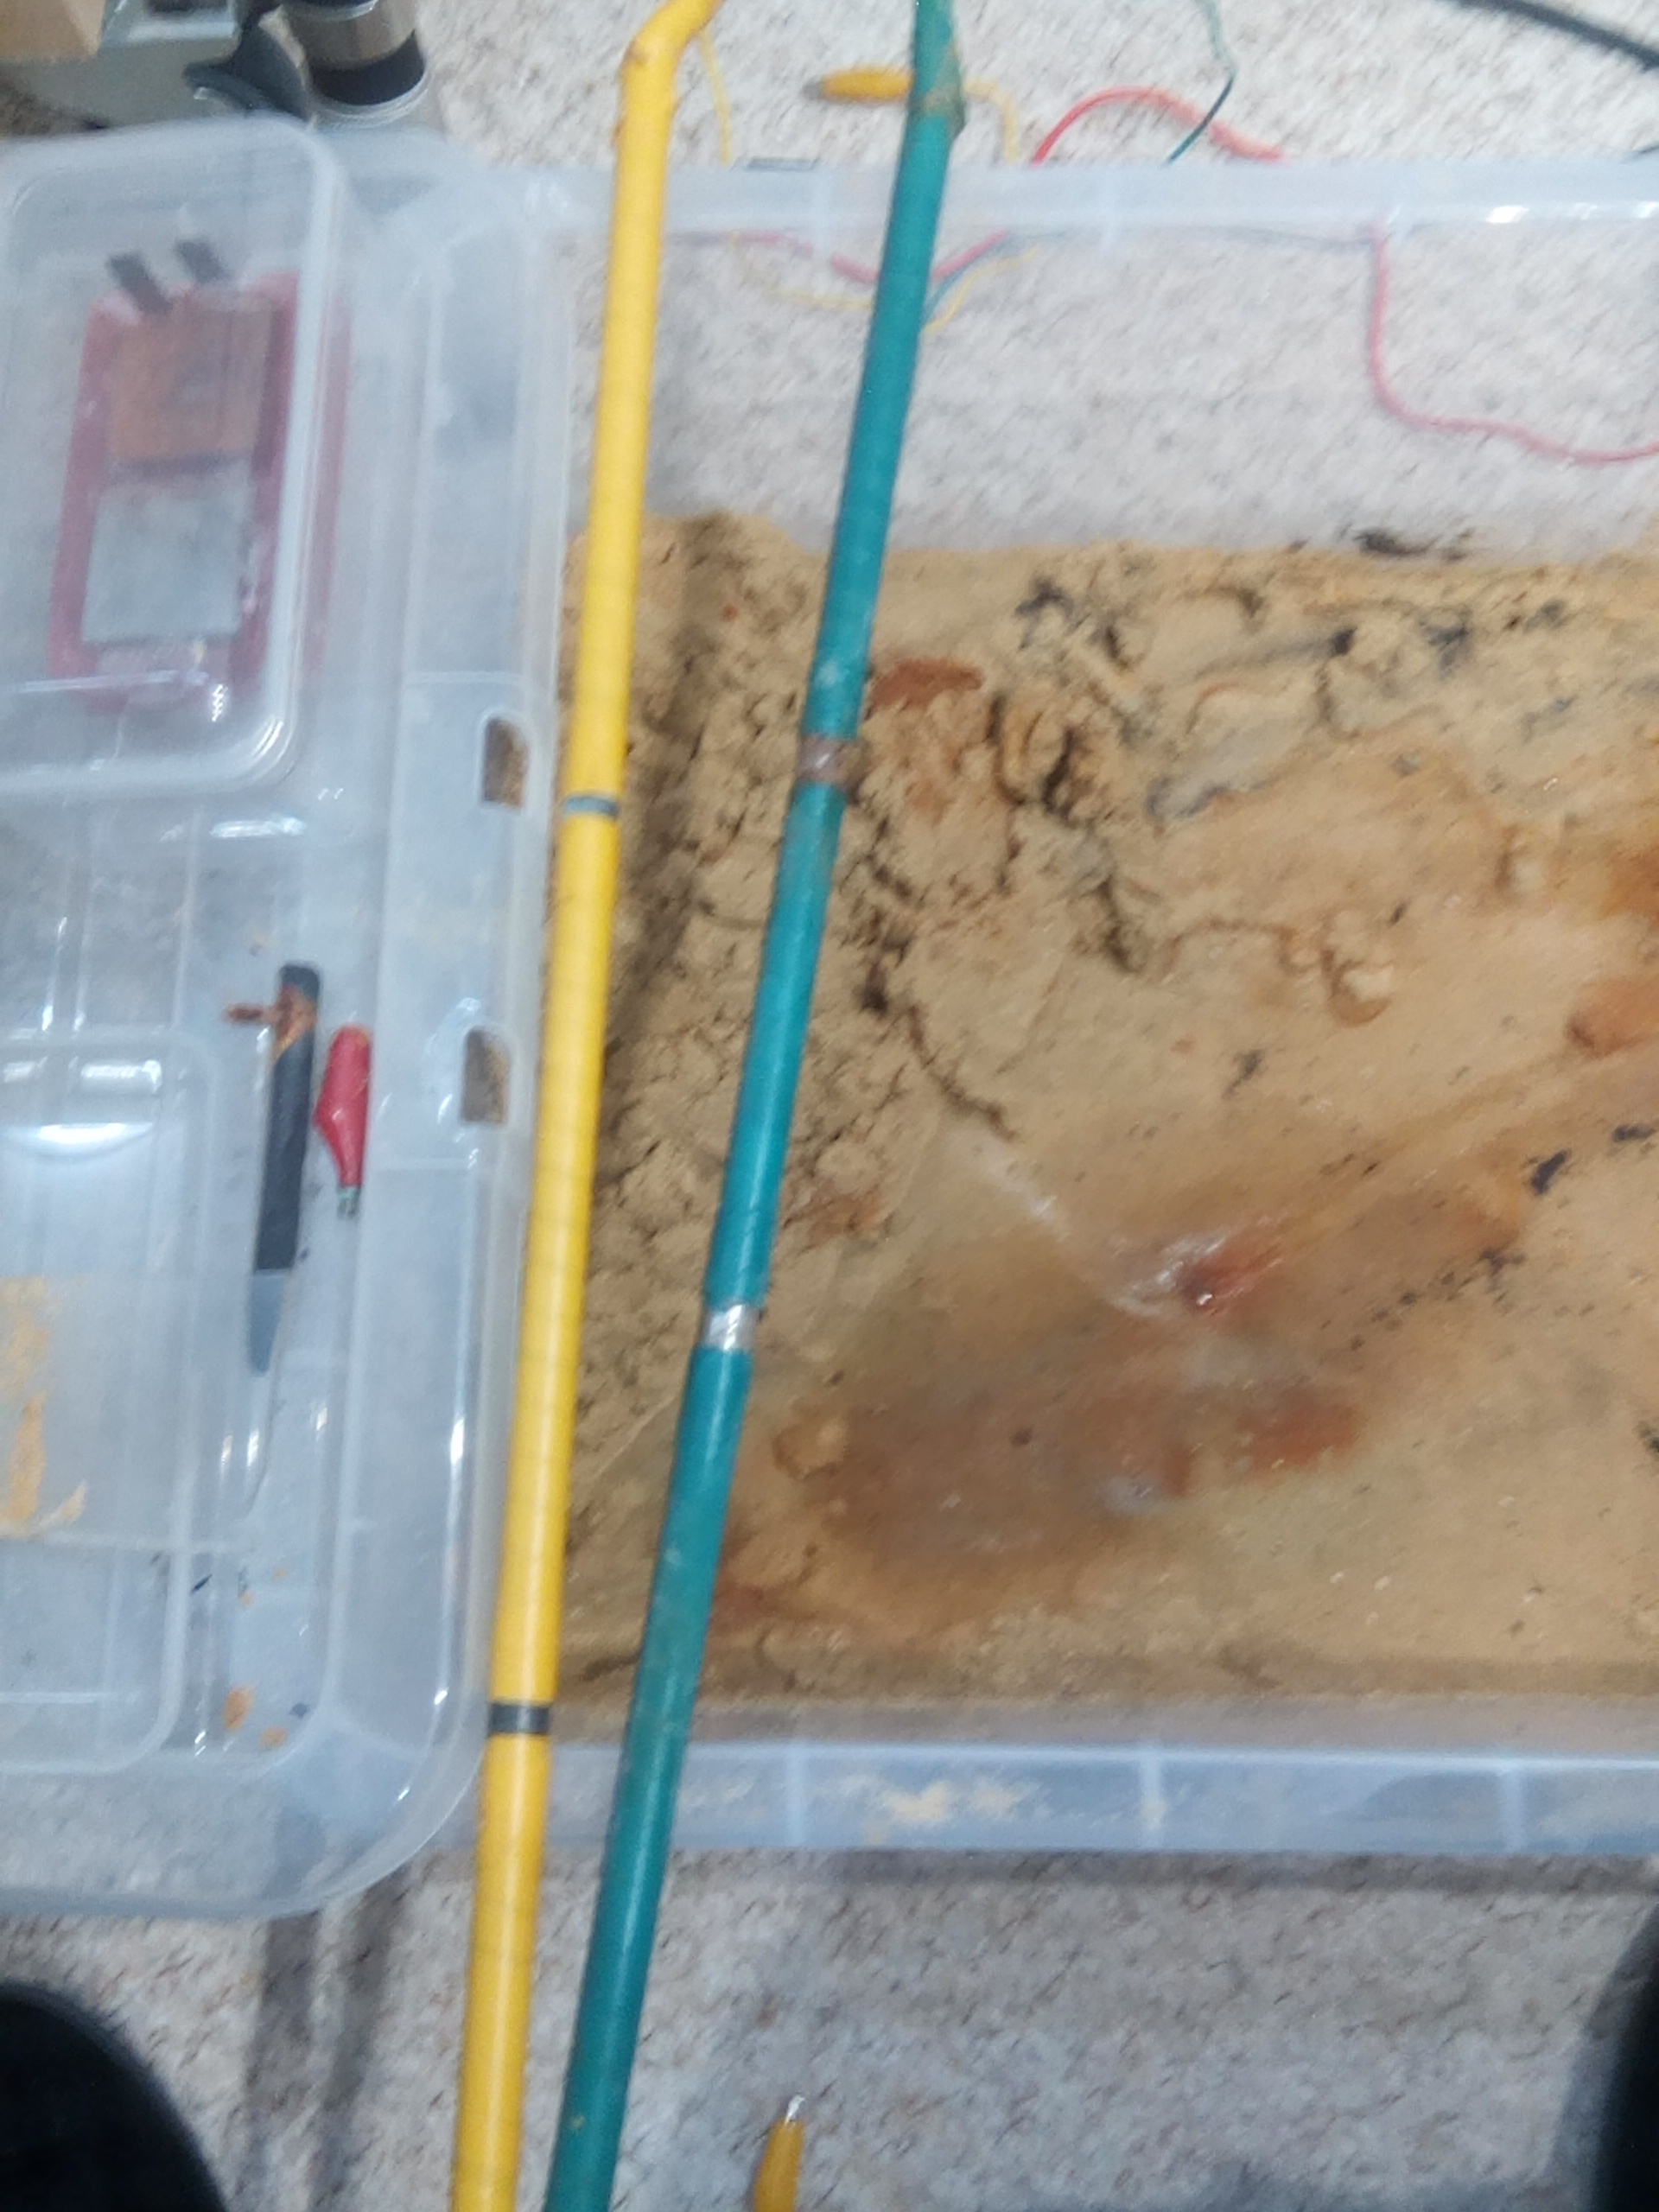
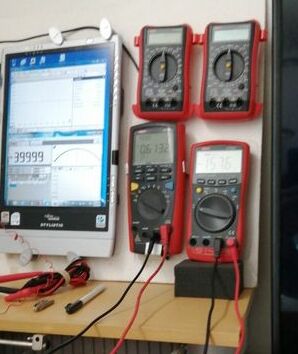
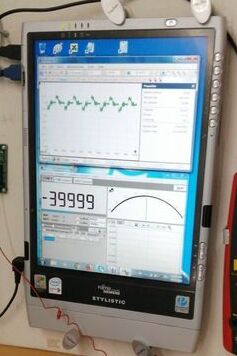
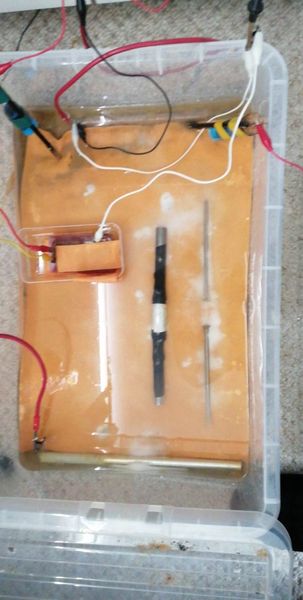
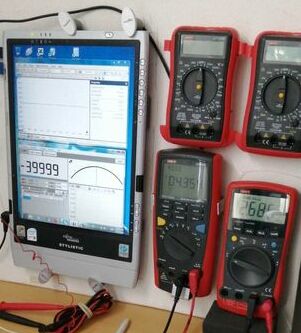
This picture shows the CPN half-cells connected to the multi-meter, data logger and oscilloscope.
37.
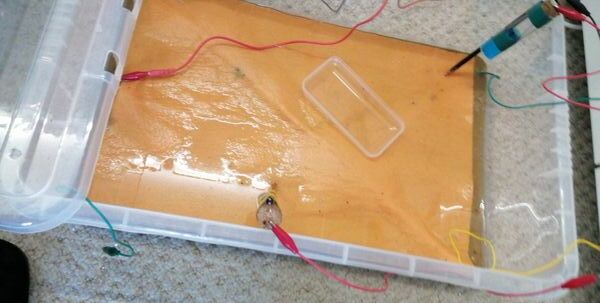
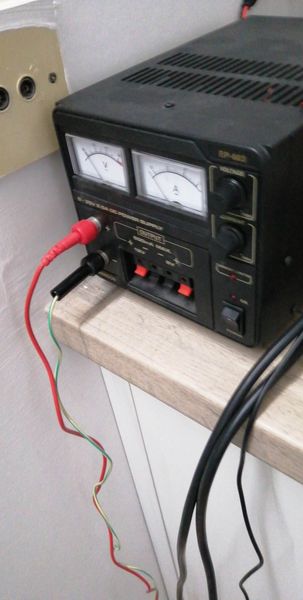
In this picture you can see the connections to the pipes for pipe to soil voltages to be measured.
38.
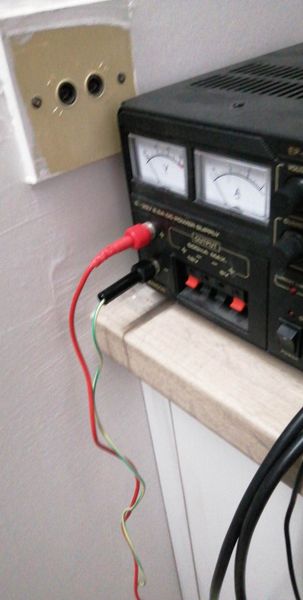
In this picture you can see the TR connections to the impressed current anode(red jumper lead) and the negative connection to the yellow taped pipe(black jumper lead). With this configuration stray current corrosion is not expected.
39.
The yellow taped CPN half-cell in it's first position in the corner of the container.
40.
This picture shows the pipe-to-soil voltage between the yellow taped pipe and the yellow taped CPN half-cell in it's first position.
41.
In this picture you can see the different position of the yellow taped CPN half-cell at the side of the container and the next picture shows the reading on the meter to be 4.24 volts.
42.
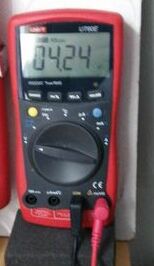
43.
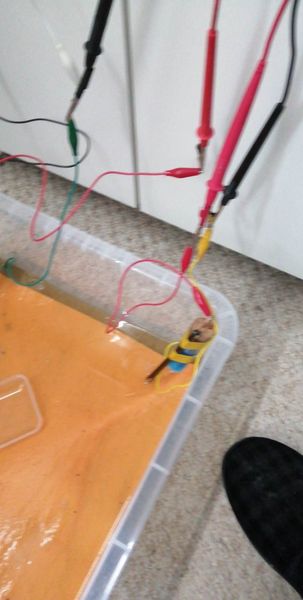
This picture shows the yellow taped CPN half-cell contacting the electrolyte close to a bracelet anode on the yellow taped pipe. The measurement below shows the effect of the depression in the potential profile caused by the current passing through less shells of resistance. This is the principle on which I invented DCVG in the mid 1970's.
44.
This picture shows the connections between the two CPN half-cells and the instruments.
45.

This picture shows the two CPN half-cells in their holding position ready for use.
46.
This shows the holding position for the two CPN half-cells.
47.
This shows the original position of the yellow taped CPN half-cell
48.
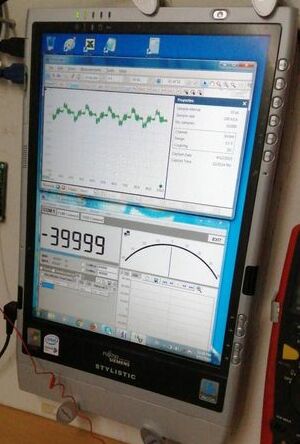
This shows the oscilloscope recording corrosion noise.
49.
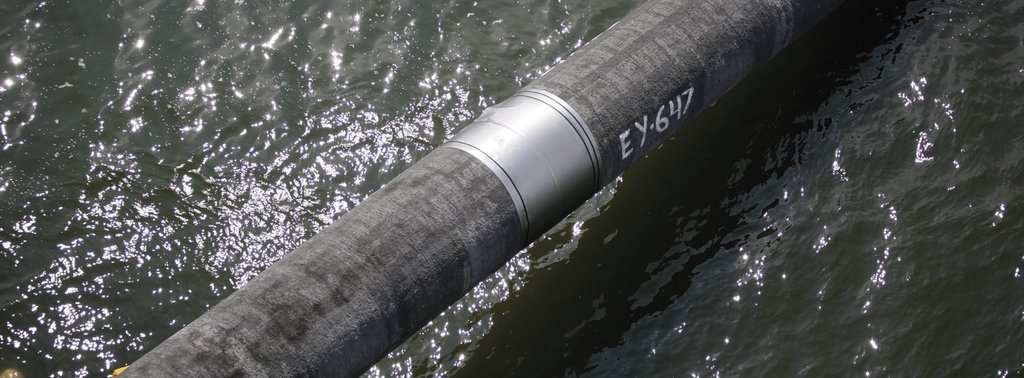
Bracelet sacrificial anode on the Nord Stream pipeline.
50.
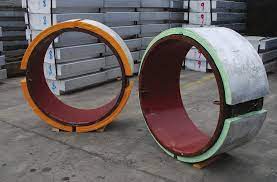
Bracelet anodes supplied for the Nord Stream pipeline.
51.
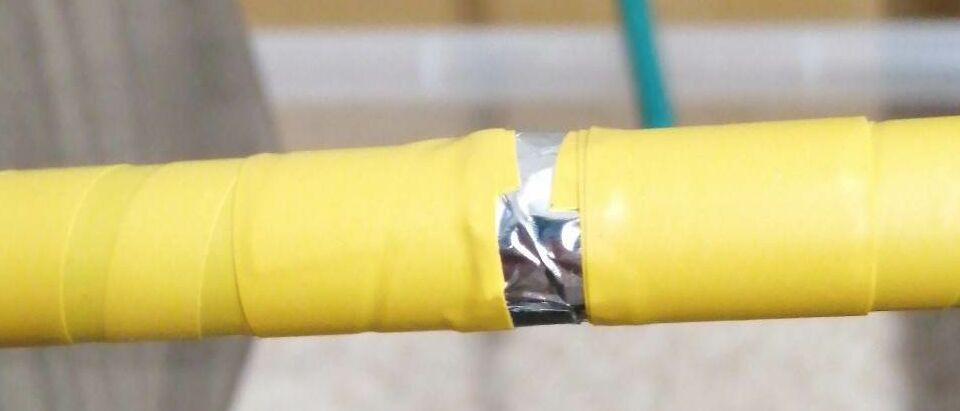
Model bracelet anode on our model yellow taped pipe.
52.
The model bracelet anodes on our two pipes.
53.
This video shows the 'pipe-to-soil-potential' of the yellow pipe to the CPN 'half-cell' placed in the top right position. -0.490v to -0.503v.
55.
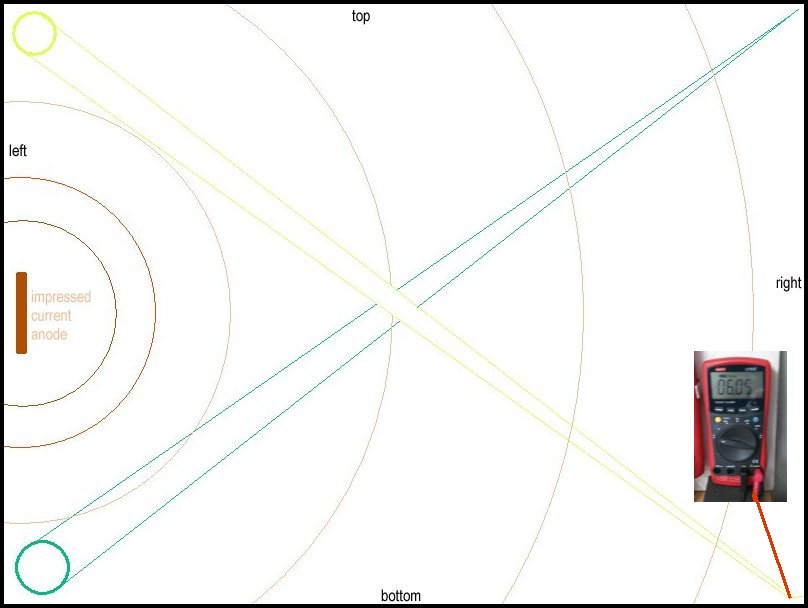
This video shows the 'pipe-to-soil-potential' of the yellow pipe to the CPN 'half-cell' placed in the top right position. -0.620v to -0.622v
56.
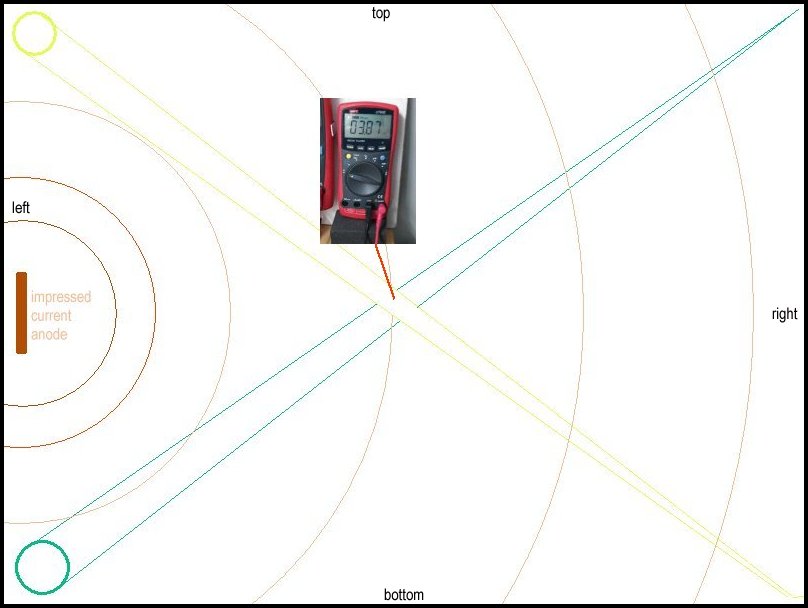
This video shows the 'pipe-to-soil-potential' of the yellow pipe to the CPN 'half-cell' placed in the top right position. -0.834v to -0.839v
57.
This video shows the'pipe-to-soil-potential' of the green pipe to the CPN 'half-cell' placed in the bottom right corner. -0.826v to -0832v
59.
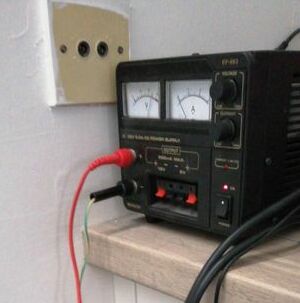
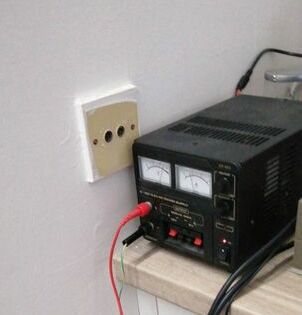
The TR was set to 25 volts impressing 0.5 amps into the system.
60.
61.
The yellow taped CPN half-cell is moved from the start position to the center of the bottom side of the container to prove that it is the position of the ground contact probe that determins the pipe-to-soil potential (that is in fact a voltage).
62.
This shows the meter reading in volts with the impressed current switched on and the carbon anode in the center of the left hand side of the container.
63
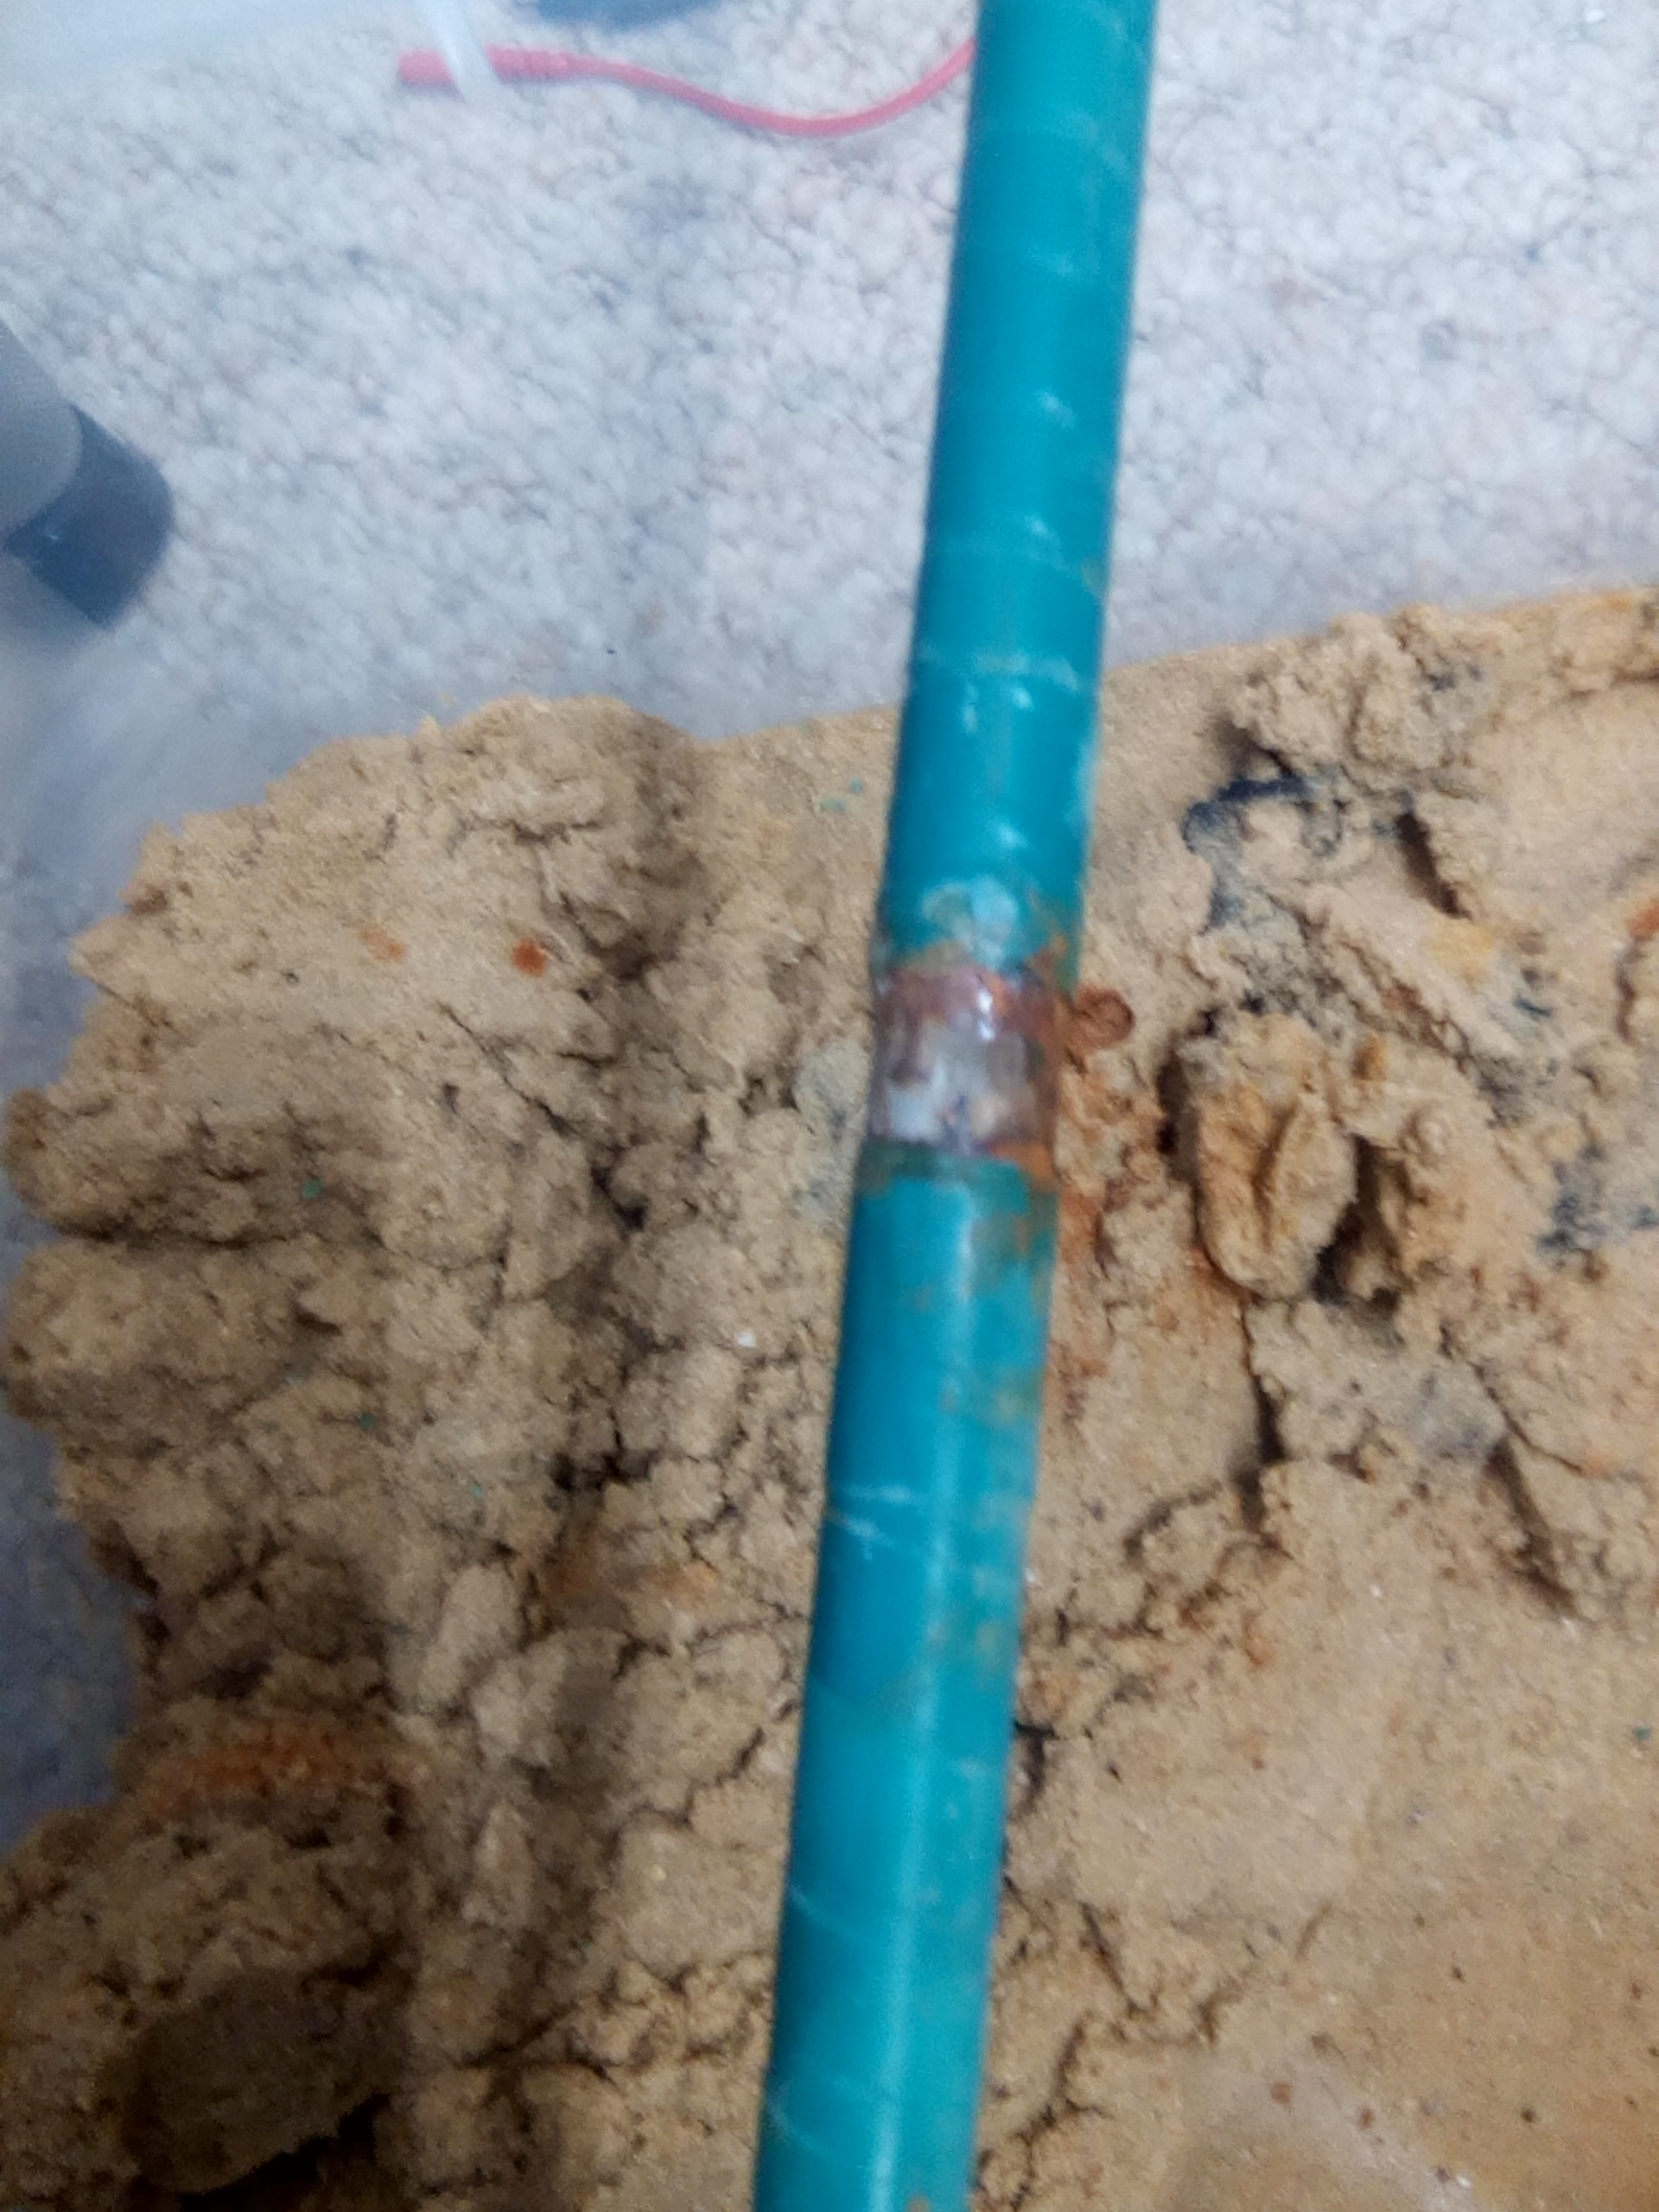
This shows the yellow taped CPN half-cell with it's graphite probe close to an aluminium foil bracelet anode on the yellow taped pipe close to the crossing with the green taped pipe underneath.
64.
This voltage is due to the impressed current into the electrolyte from the carbon anodes at the left hand side of the container, the corrosion reaction of the aluminium foil/steel pipe galvanic reaction on the yellow taped pipe and the aluminium foil/steel pipe galvanic reaction on the green taped pipe below.
65.
57a.
58.
This stage of the experiment was set up to observe the effect of stray current from the impressed current anode onto the green taped pipe and off to the yellow taped pipe..
66.
The above set-up was left for about 4 hours and the anode and pipes were uncovered and inspected as seen in the following pictures.
66d.
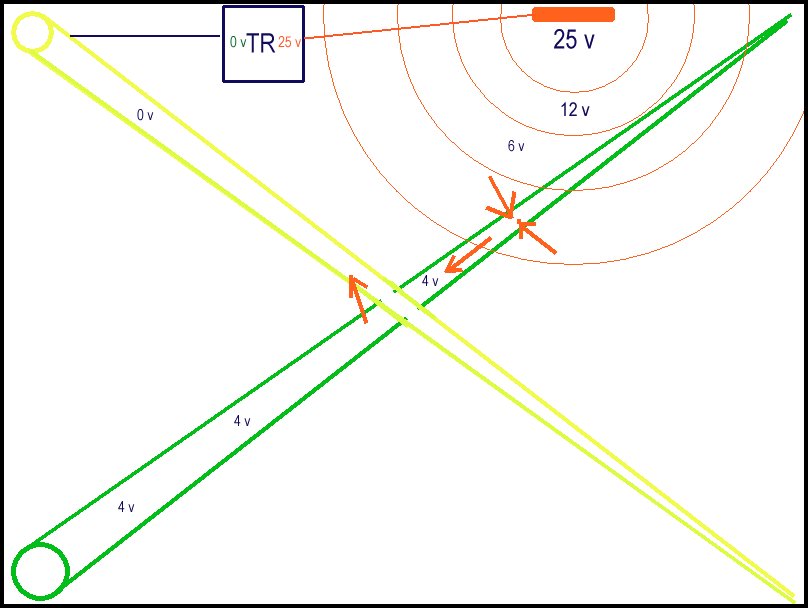
The TR generates 25 volts electrical pressure (potential) between the output and the input. these charges leave the carbon rod anode following Kirchhoffs laws following the paths of least resistance and this can roughly be equivalent to the inverse square law of radiation as shown in the sketch by the red expanding circles. The red arrows show that the potential of the wet sand in this zone is greater than the potential of the corrosion reaction of the alluminium foil and the green taped pipe is charged toa higher potential than the wet sand in the zone of the other bracelet anode/ alluminium foil on the green taped pipe. The yellow taped pipe is being drained of charges and Gibbs Free Energy proves that there can be no zero energy, therefore the charges enter the yellow taped pipe to complete their circuit back to the TR.
The yellow taped pipe is over-protected that degrades the bracelet anodes and causes hydrogen embrittlement to the steel (turning it black)
The above set-up was left for about 4 hours and the anode and pipes were uncovered and inspected as seen in the following pictures.
67.
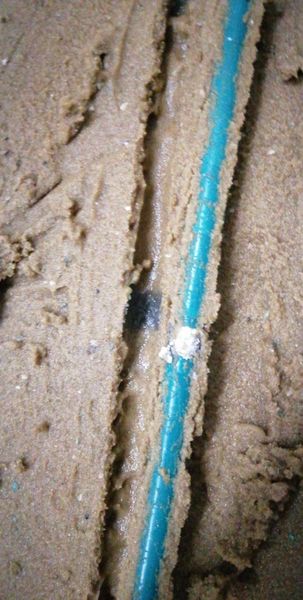
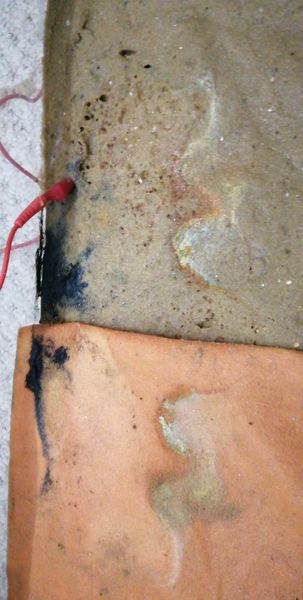
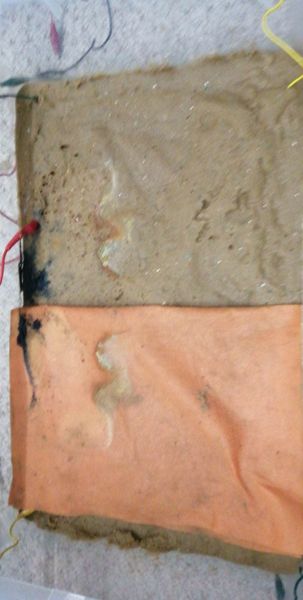
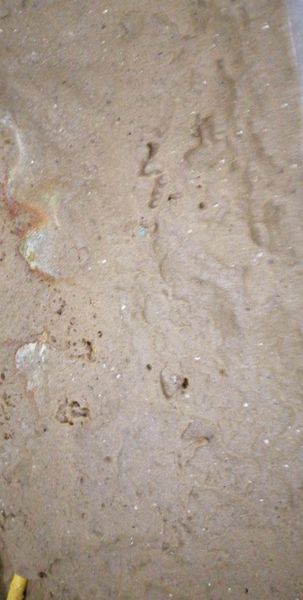
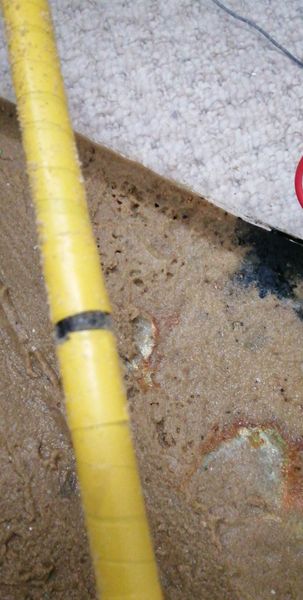
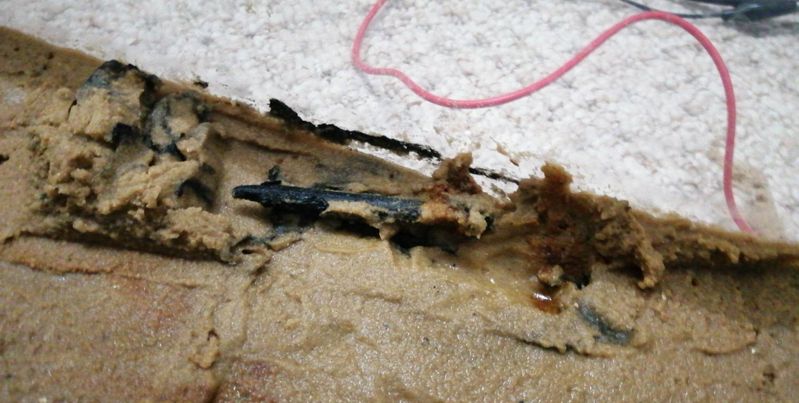
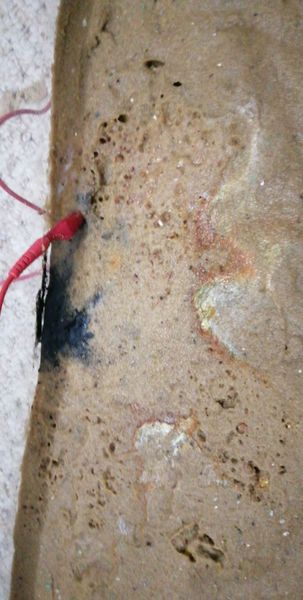
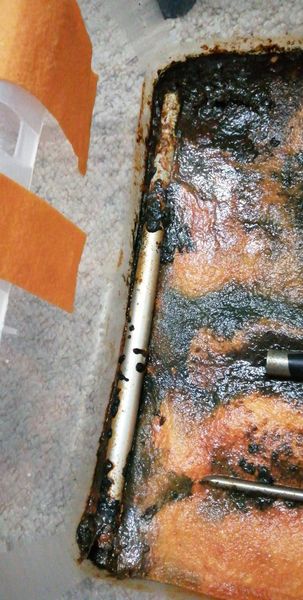
Folding back the super-absorbant clothrevealed pits in the sand where gas had escaped from the corrosion reaction and a black discolouring on the sand and the cloth.
68.
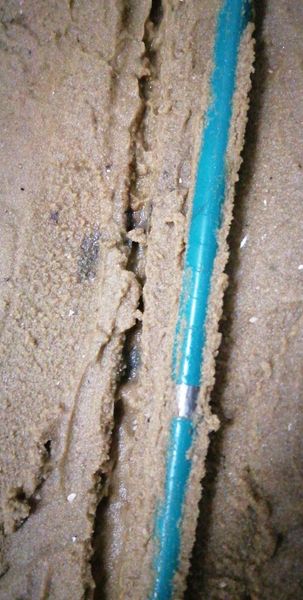
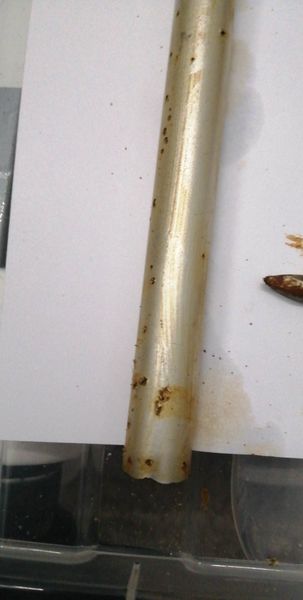
Folding back further revealed further discolouration and a clear hole in the sand revealing the bright metal of the yellow taped pipe that was subject to the impressed current CP system. This hole in the sand was probably caused by the escape of hydrogen gas released during embrittlement caused by over protection. Note that the sand is not stained at this location
69a.

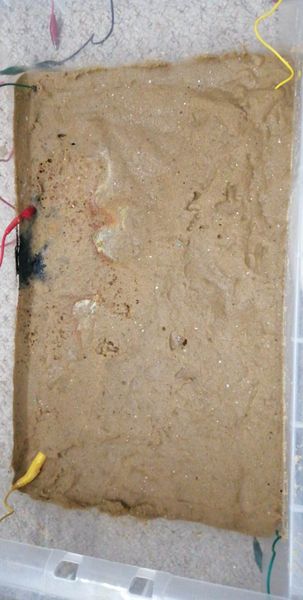
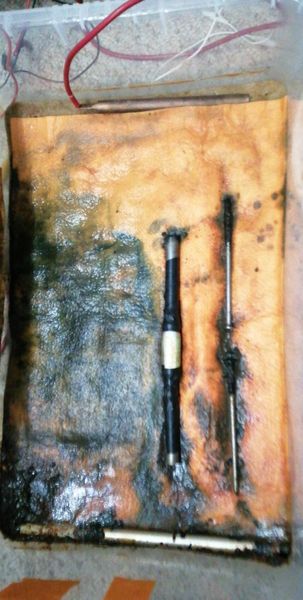
Some sand has been scraped back to reveal the discolouring of the sand and to show the position of the green taped pipe
70a.
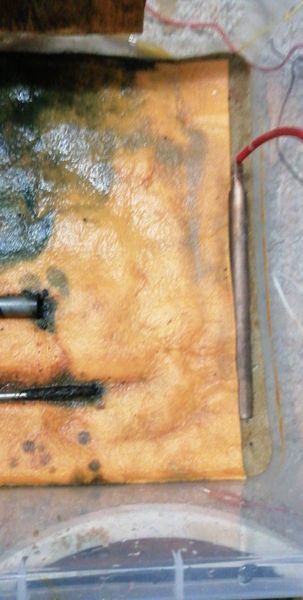
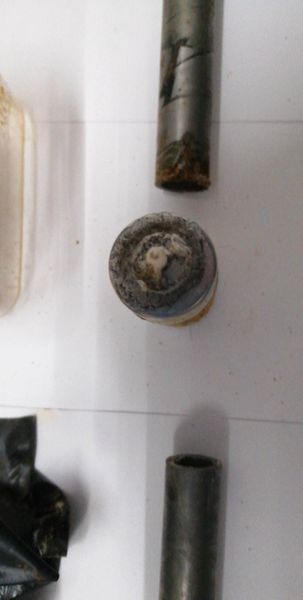
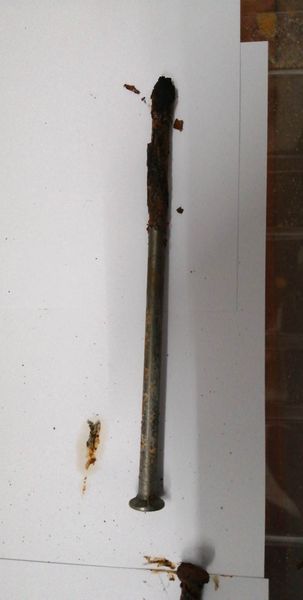
The carbon rod impressed current anode is lifted from its position and we can see that the crocodile clip has dissolved and much of the carbon is now in the sand.
70b.
closer view of the carbon rod impressed current anode
69.
The sand scraped back.
70.
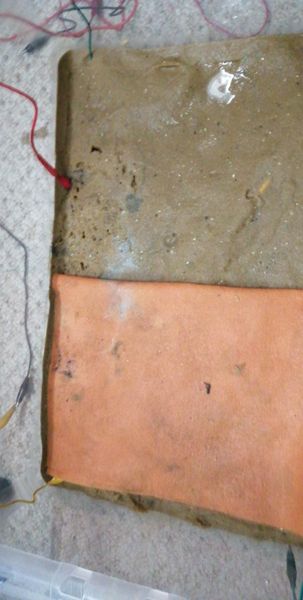
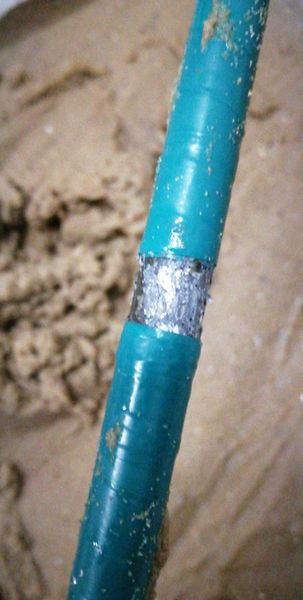
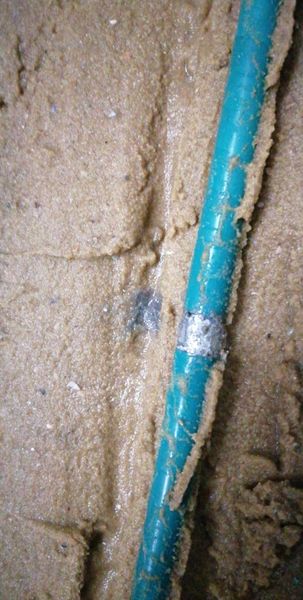
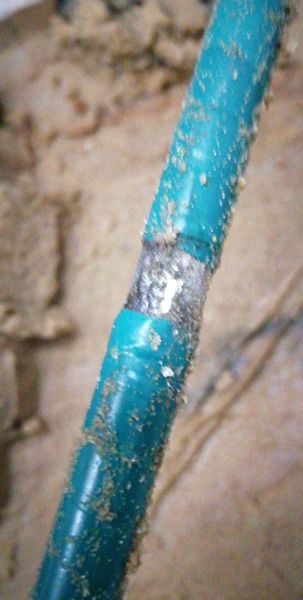
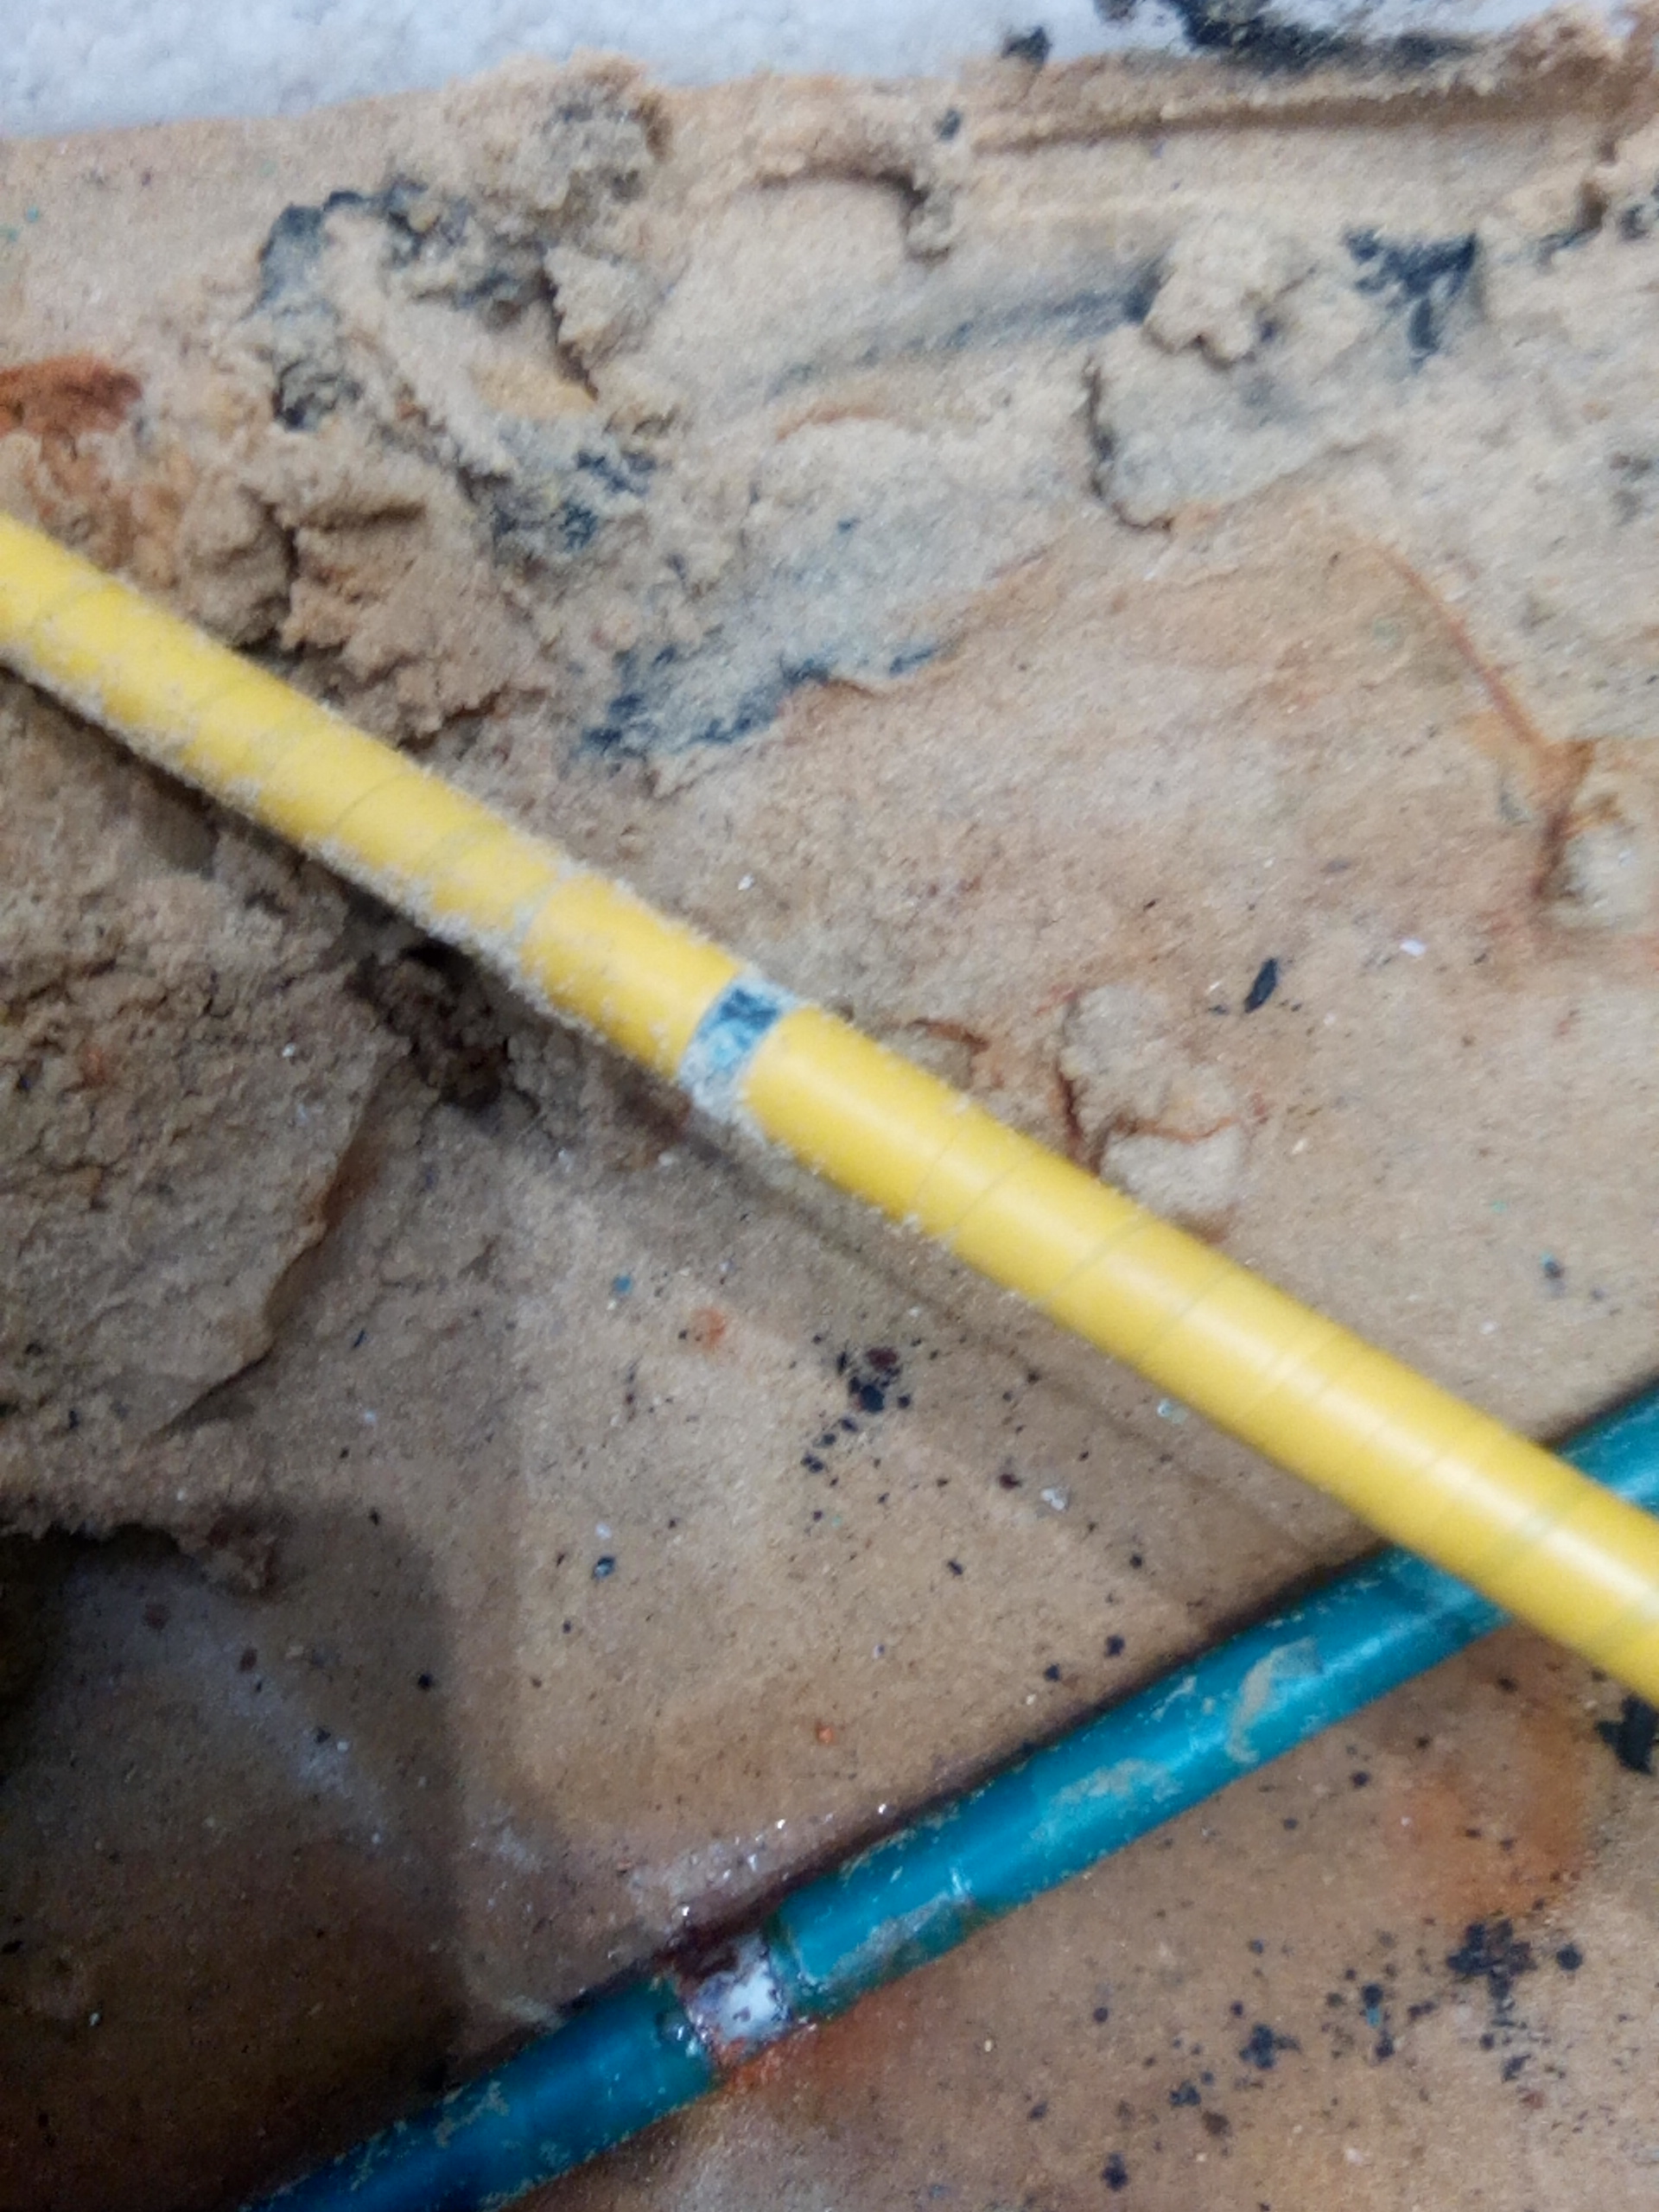
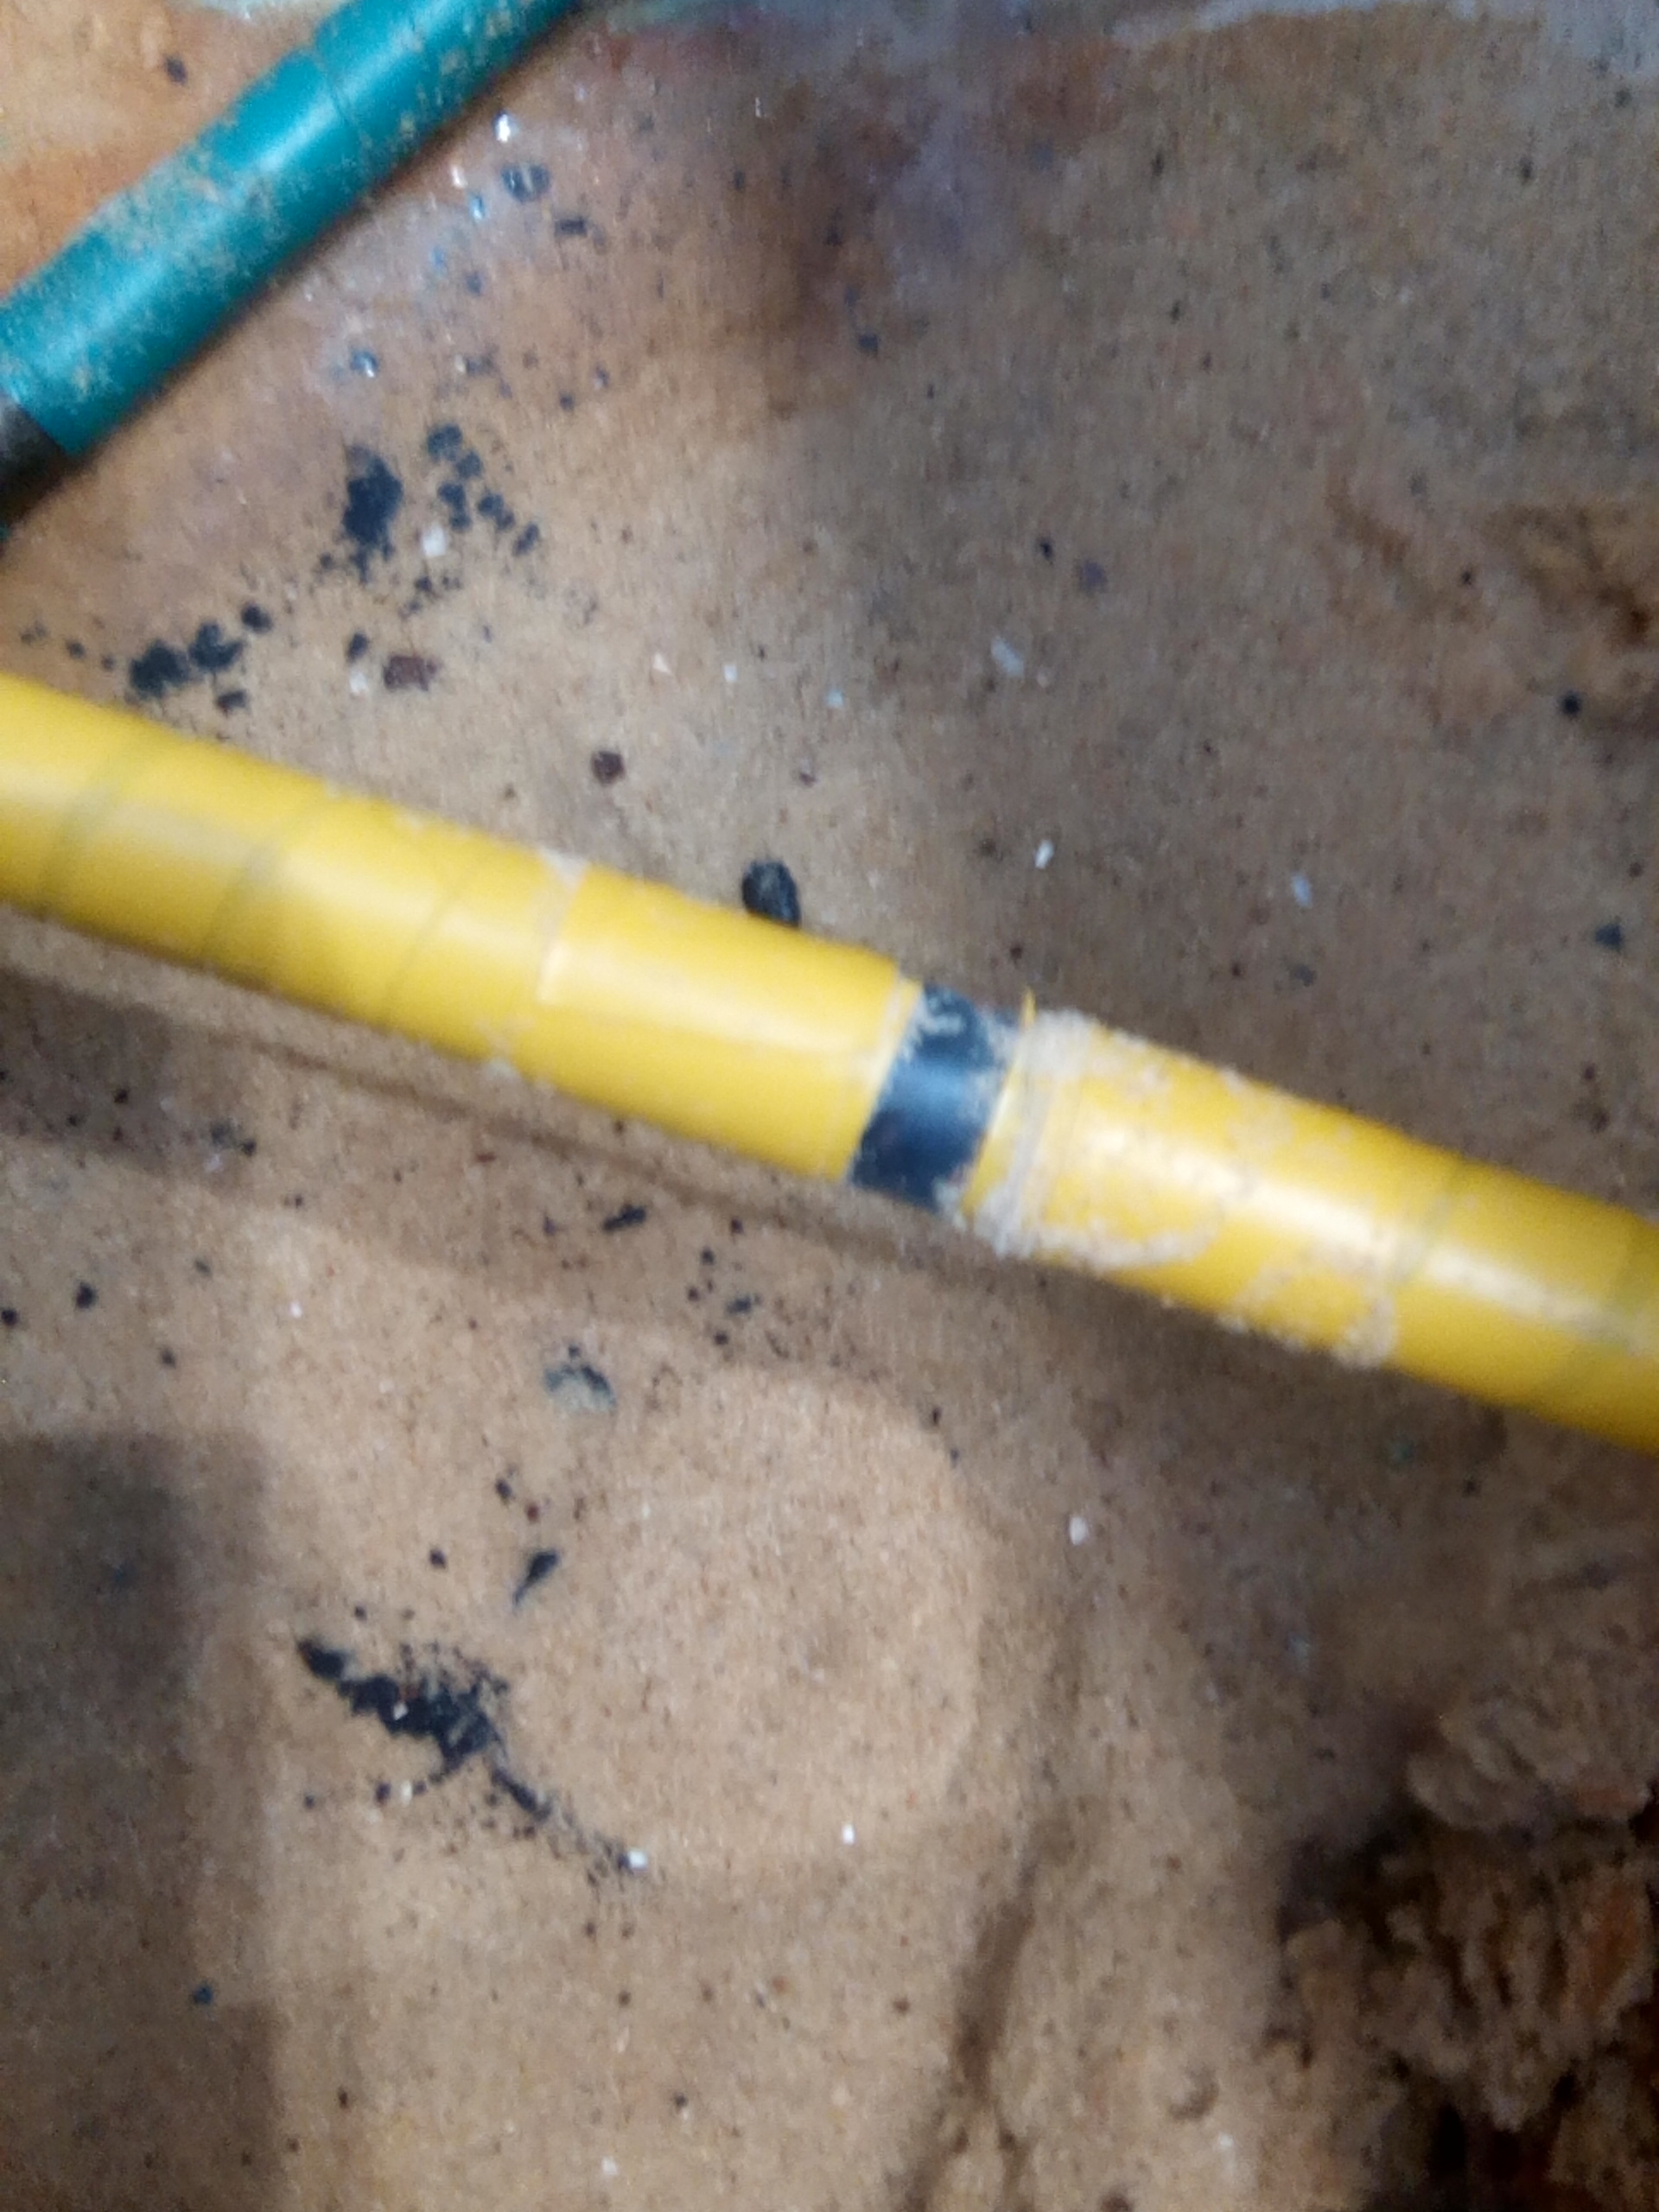
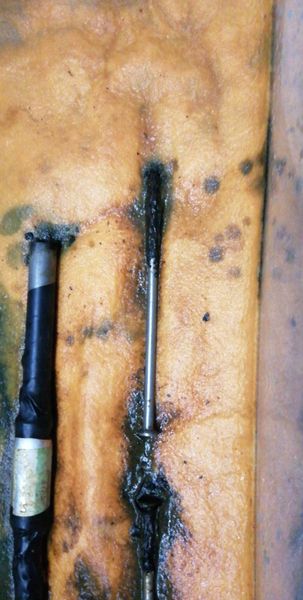
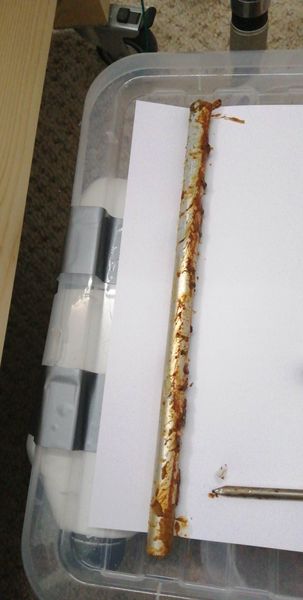
It can be seen that the aluminium foil on the yellow taped pipe has dissolved and the steel has turned black.
This supports the notion that overprotection causes hyrogen embrittlement.
71.
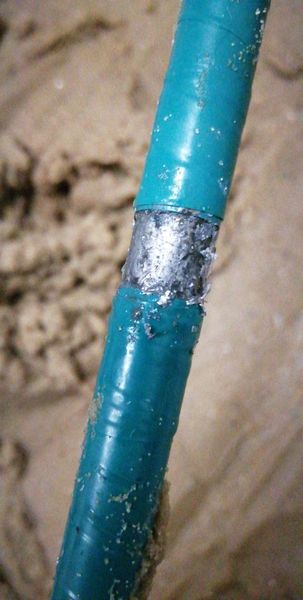
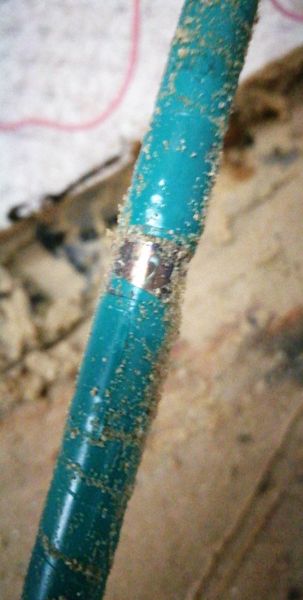
 In this picture you can see the blackening of the metal on the yellow taped pipe and that the aluminium foil is fragmenting on the green taped pipe
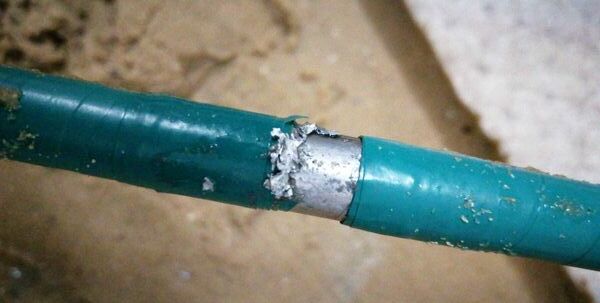
72.
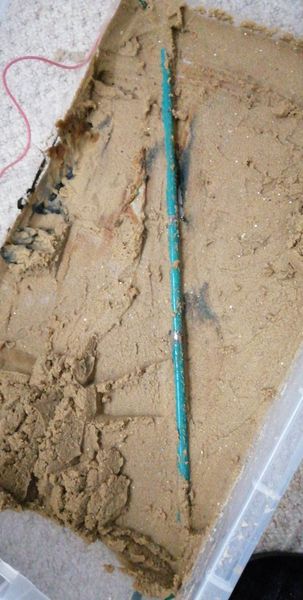
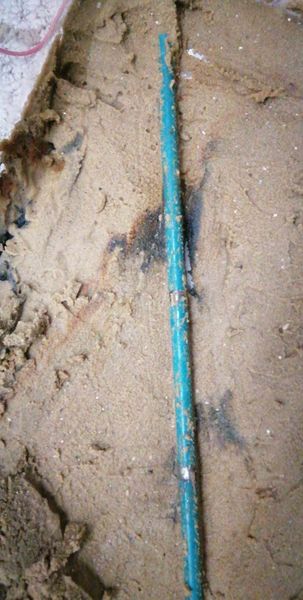
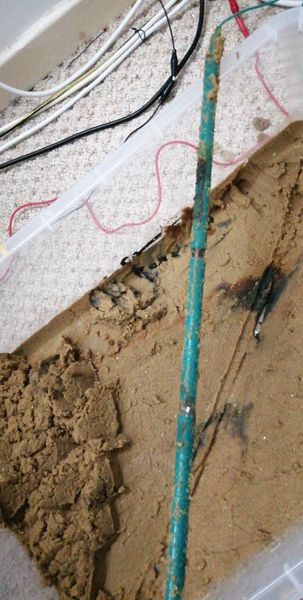
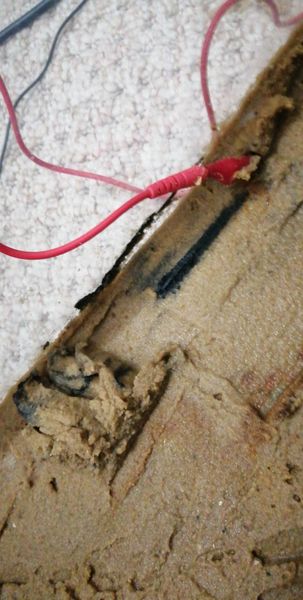
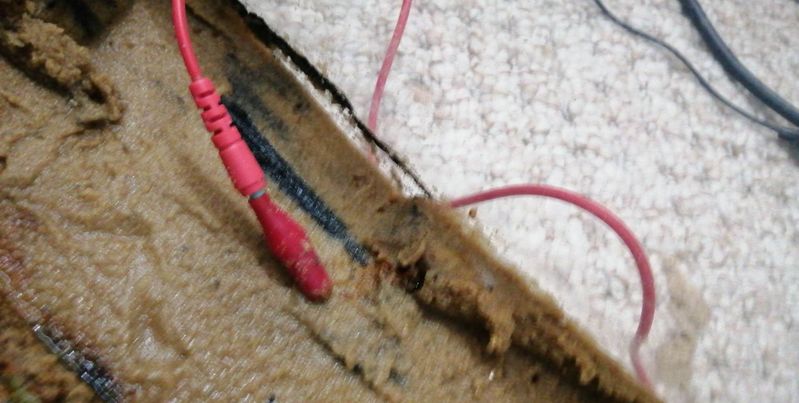
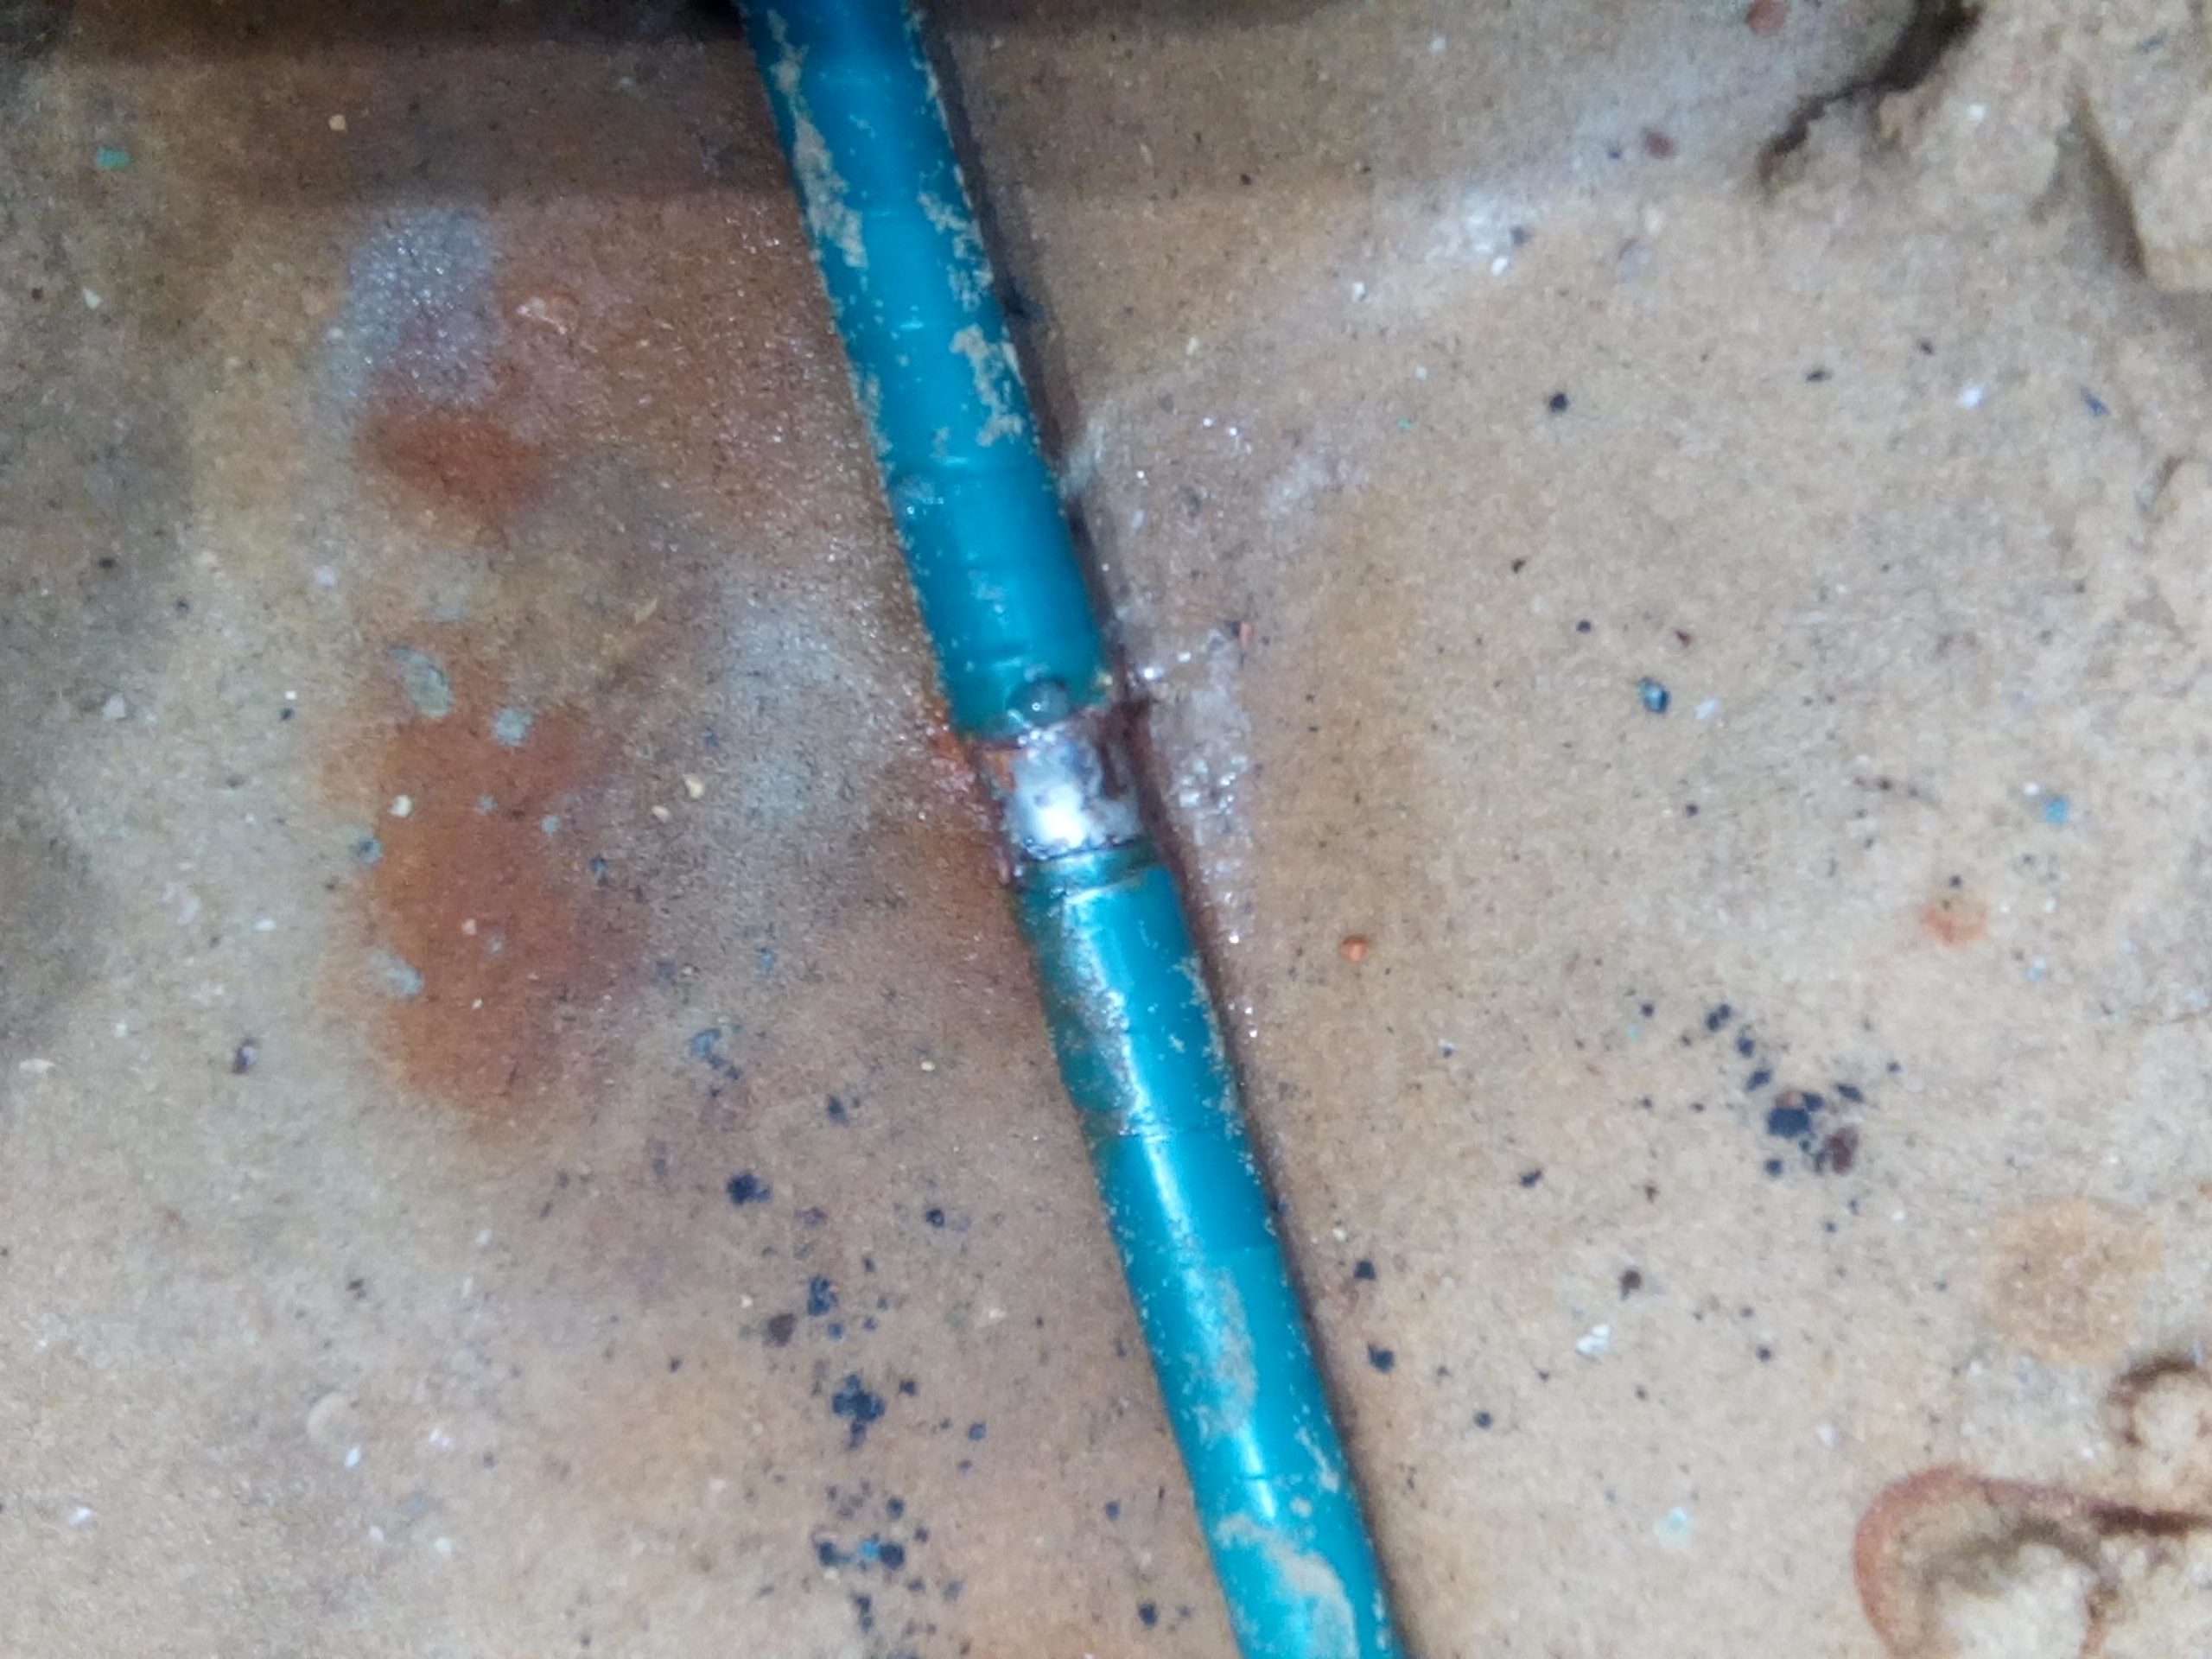
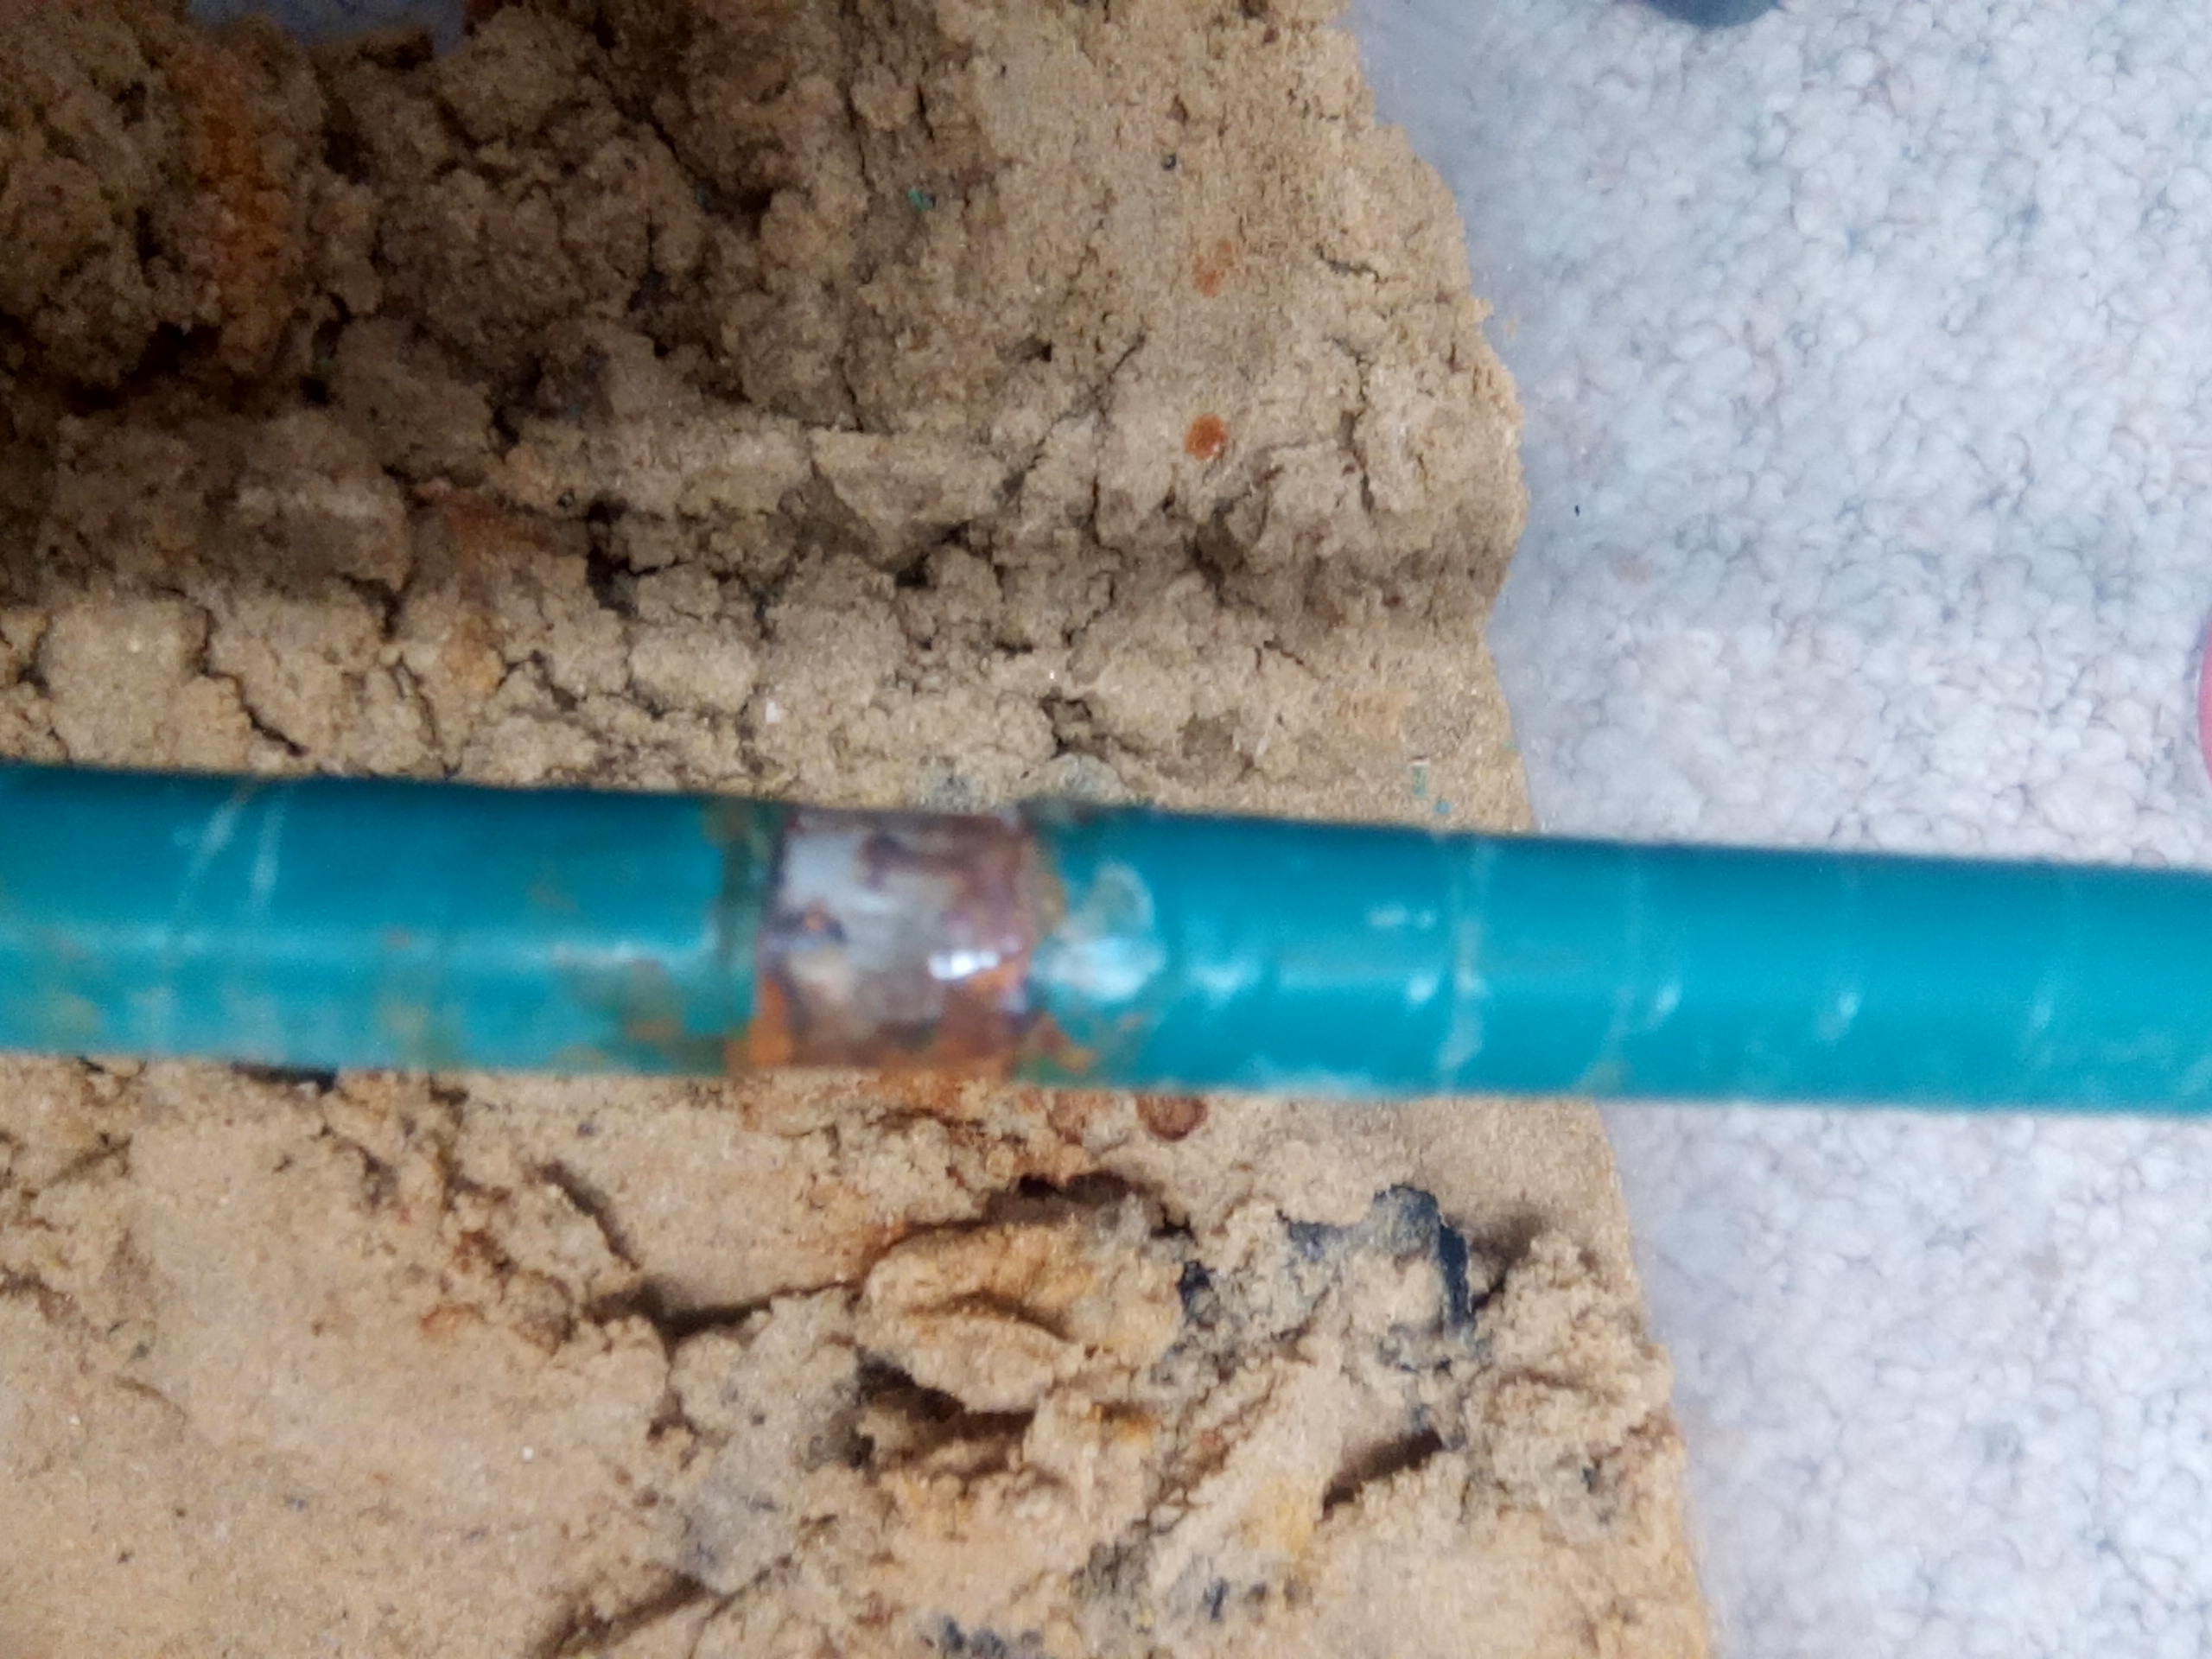
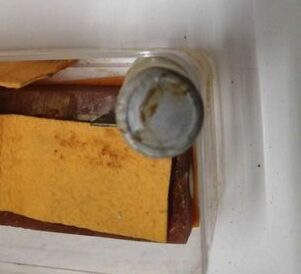
In this picture the green taped pipe has been lifted from it' trench and you can see the black stain where the aluminium foil has been affected by the stray current from the impressed current system of the yellow pipe.
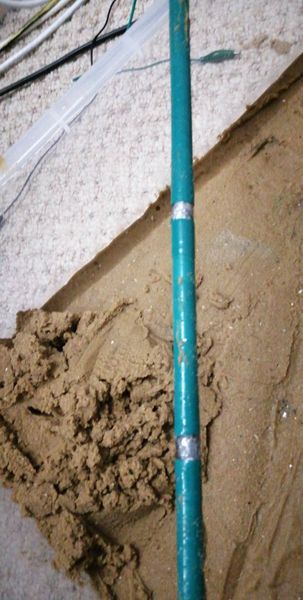
73.
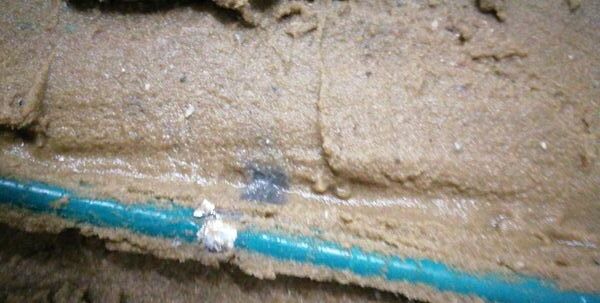
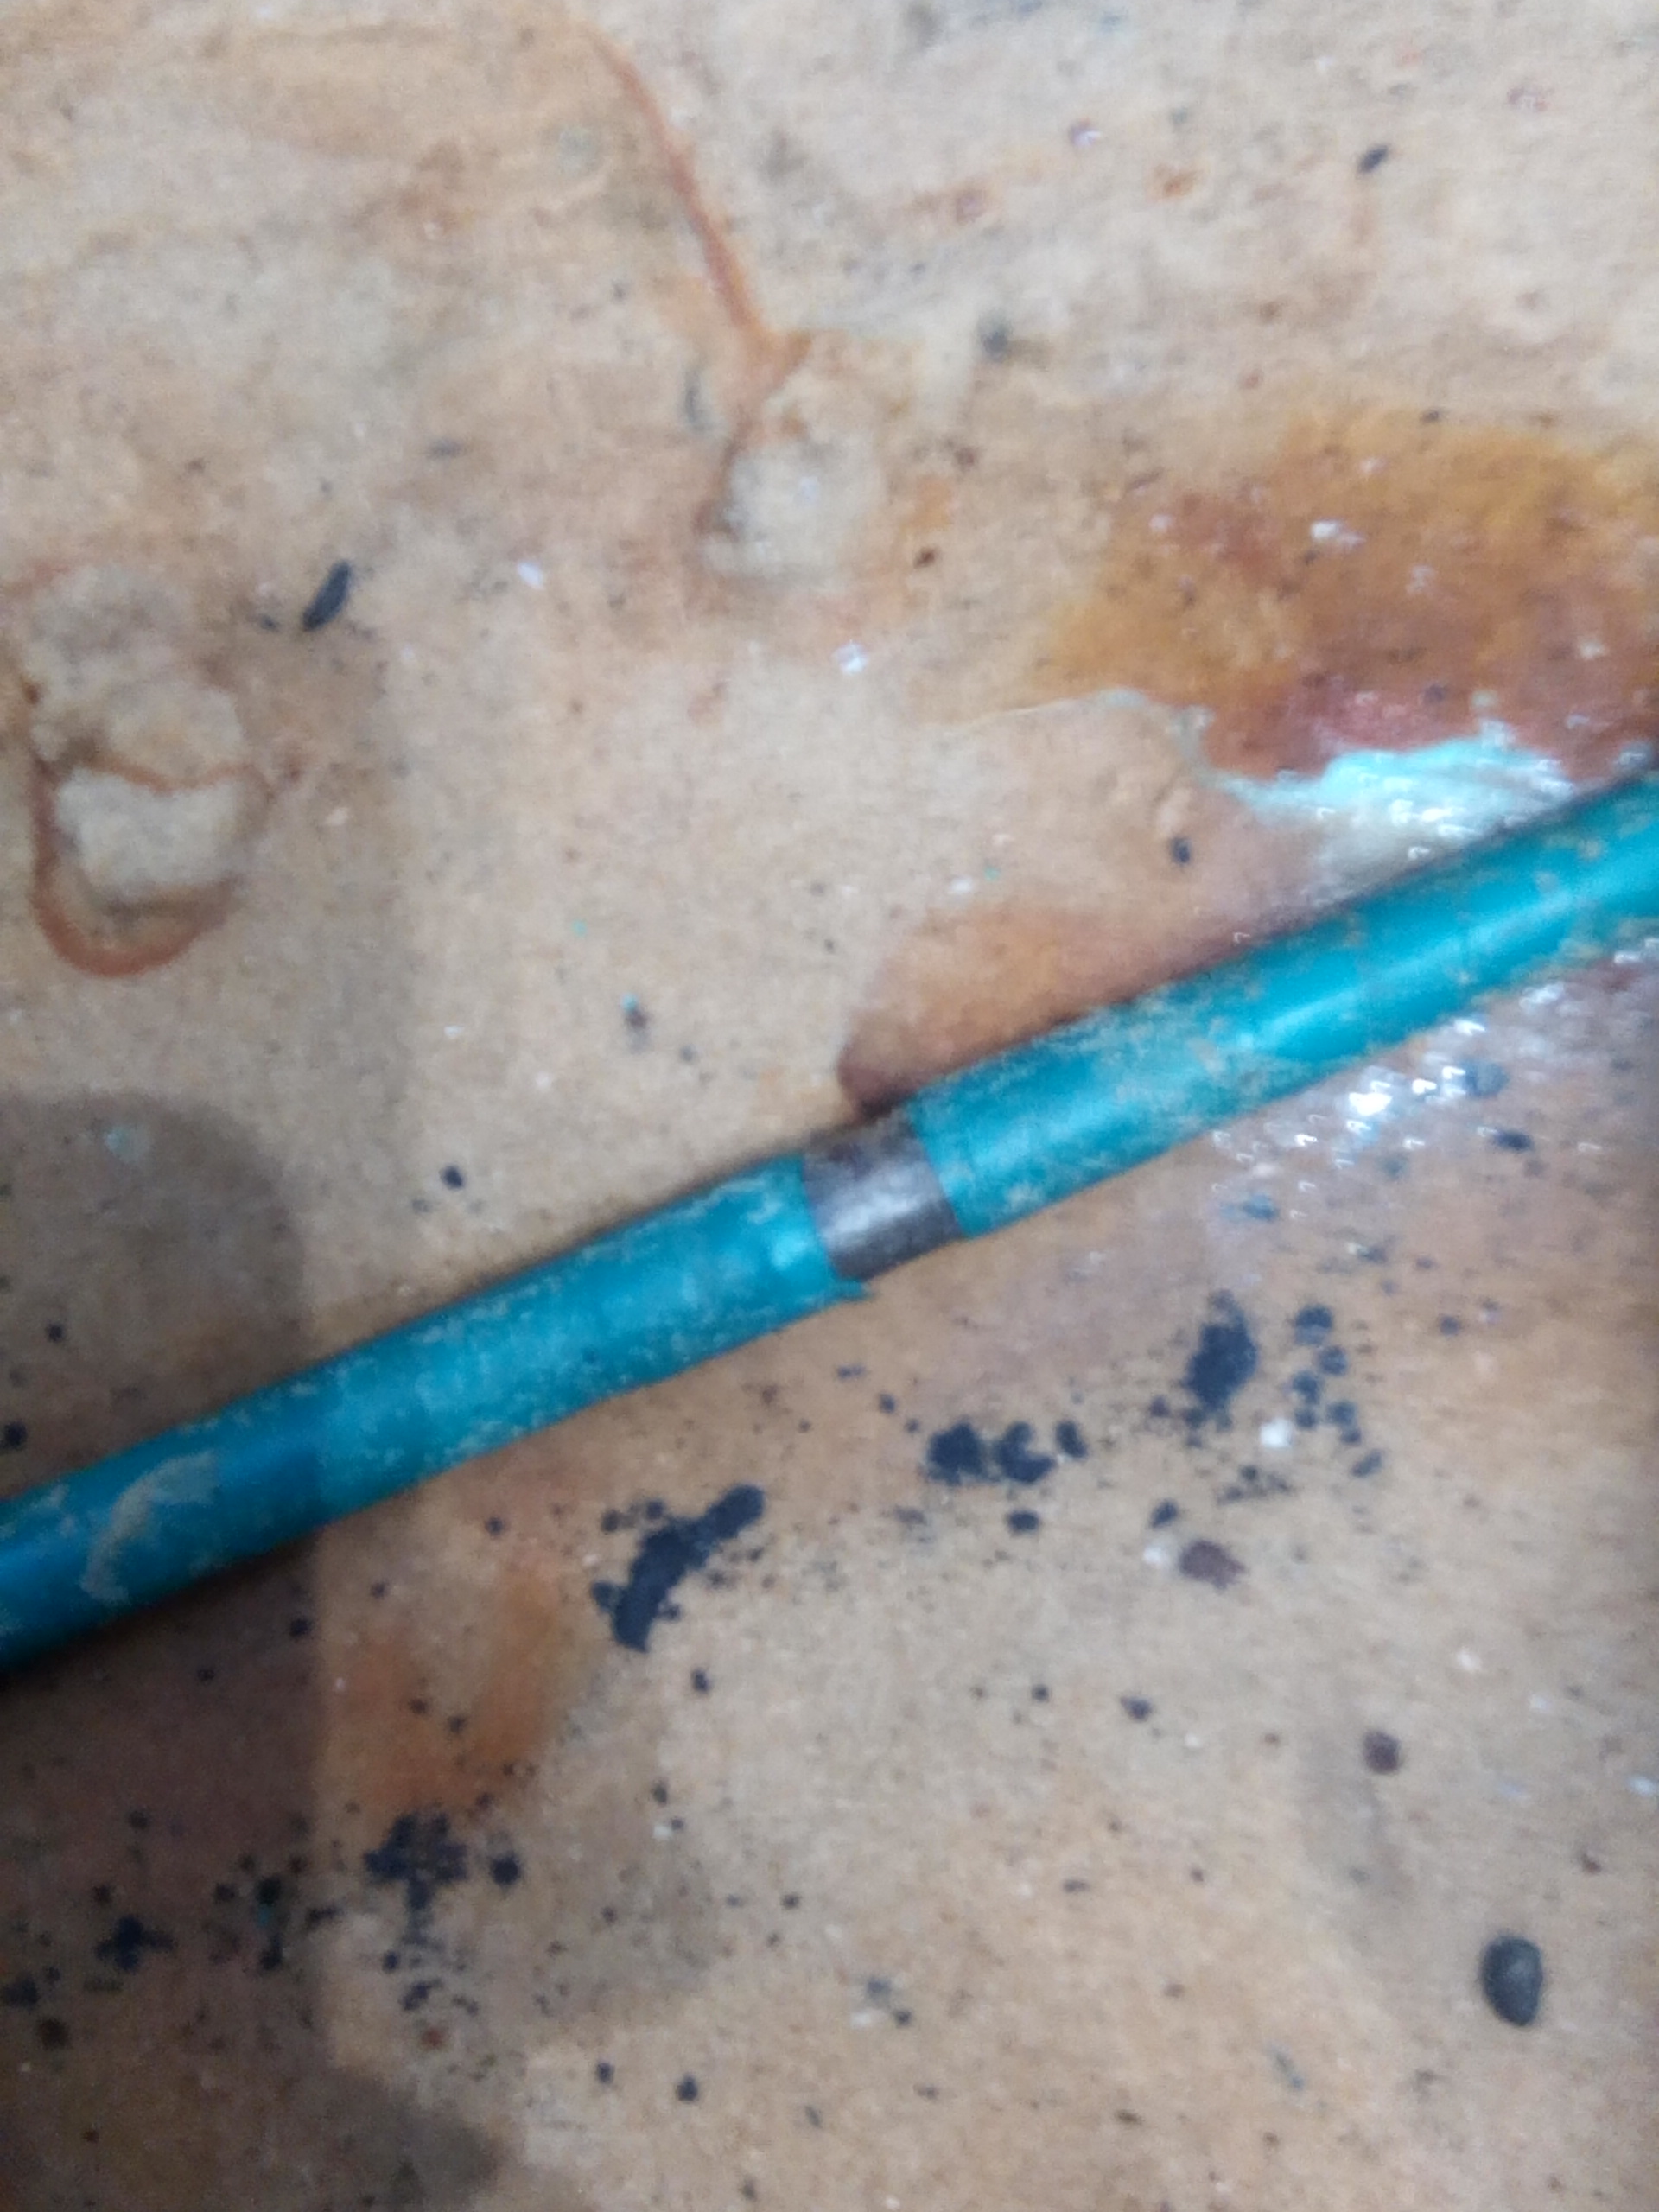
In this pic you can see the stain in the trench and the damage to the aluminium bracelet anode.
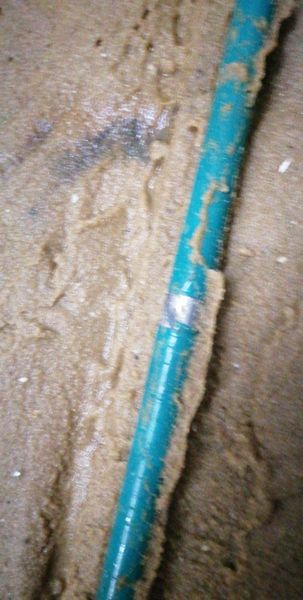
74.
In this picture you can see that I have scraped the aluminium back with my fingernail to reveal pitting caused by the stray current in just 4 hours.
75.
76.
77.
78.
79.
80.
81.
82.
83.
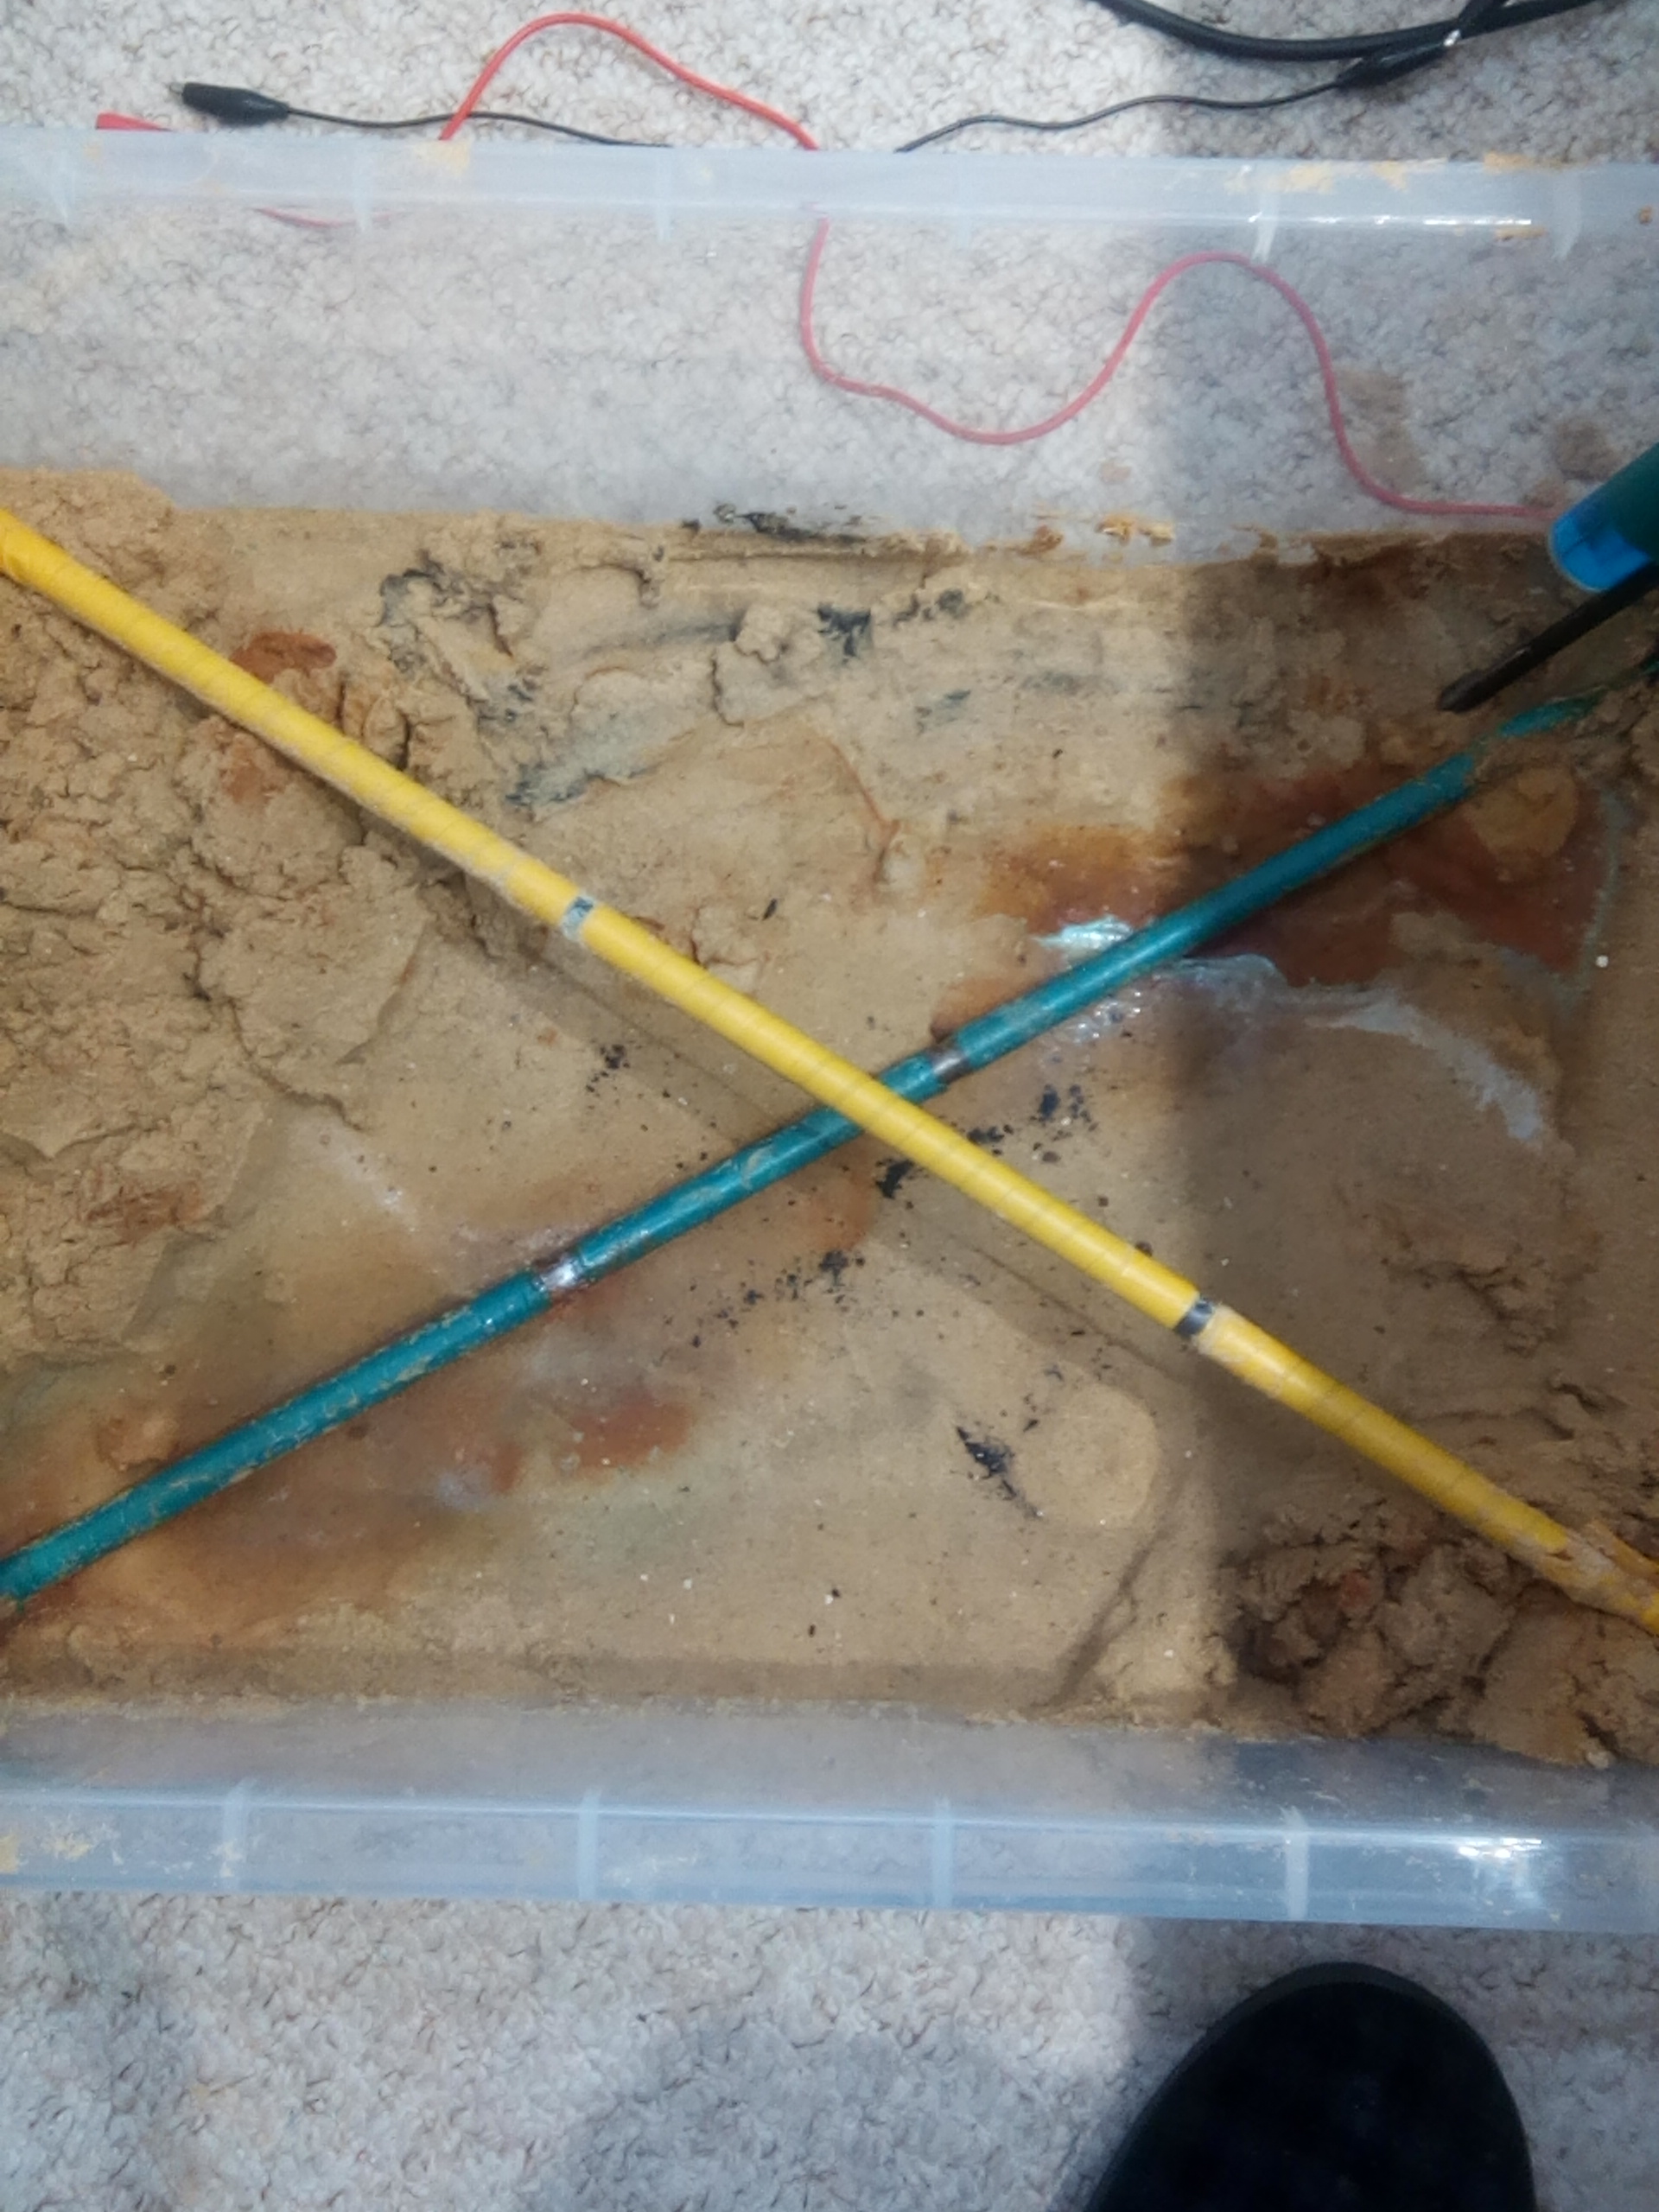
In this picture the yellow taped pipe is seen crossing over the green taped pipe for the second run of this interference currents test.
84.
In this picture I have reset this stage of the experiment to see the effects of a longer period of time.
86.
TR off, no CP energy supply.
87.
Corrosion noise and free energy.(static)
87.
Set up for the night.
88.
Set up for the night.
89.
Set up for the night.
90.
Set up for the night.
91.
TR switched off
92.
TR switched off
92.
The cloth is folded back to reveal the sand
92.
Note the discolouration on the sand and the stains on the cloth caused by electrical energy.
93.
Note the discolouration on the sand and the holes caused by gas released from the electrochemical reactions.
94.

Note the holes caused by gas released from the electrochemical reactions.
95.

This is the layer of sand over the yellow taped pipe.
96.
This is also the layer of sand over the yellow taped pipe.
97.

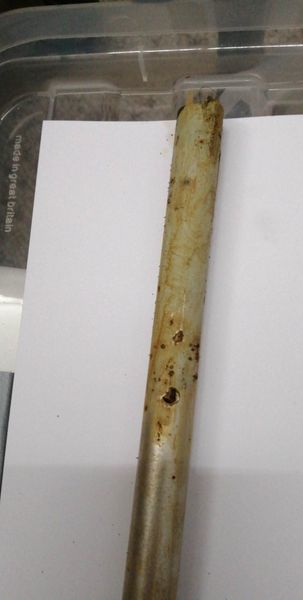
The yellow taped pipe is exposed
98.

The yellow taped pipe is uncovered.
99.
The yellow taped pipe is lifted out of the sand for closer inspection.
100.
The yellow taped pipe is lifted out of the sand for closer inspection.
101.
The yellow taped pipe for closer inspection.
101.
The yellow taped pipe for closer inspection.
102.
The yellow taped pipe black metal scratched to show the effect of over-protection.
103.
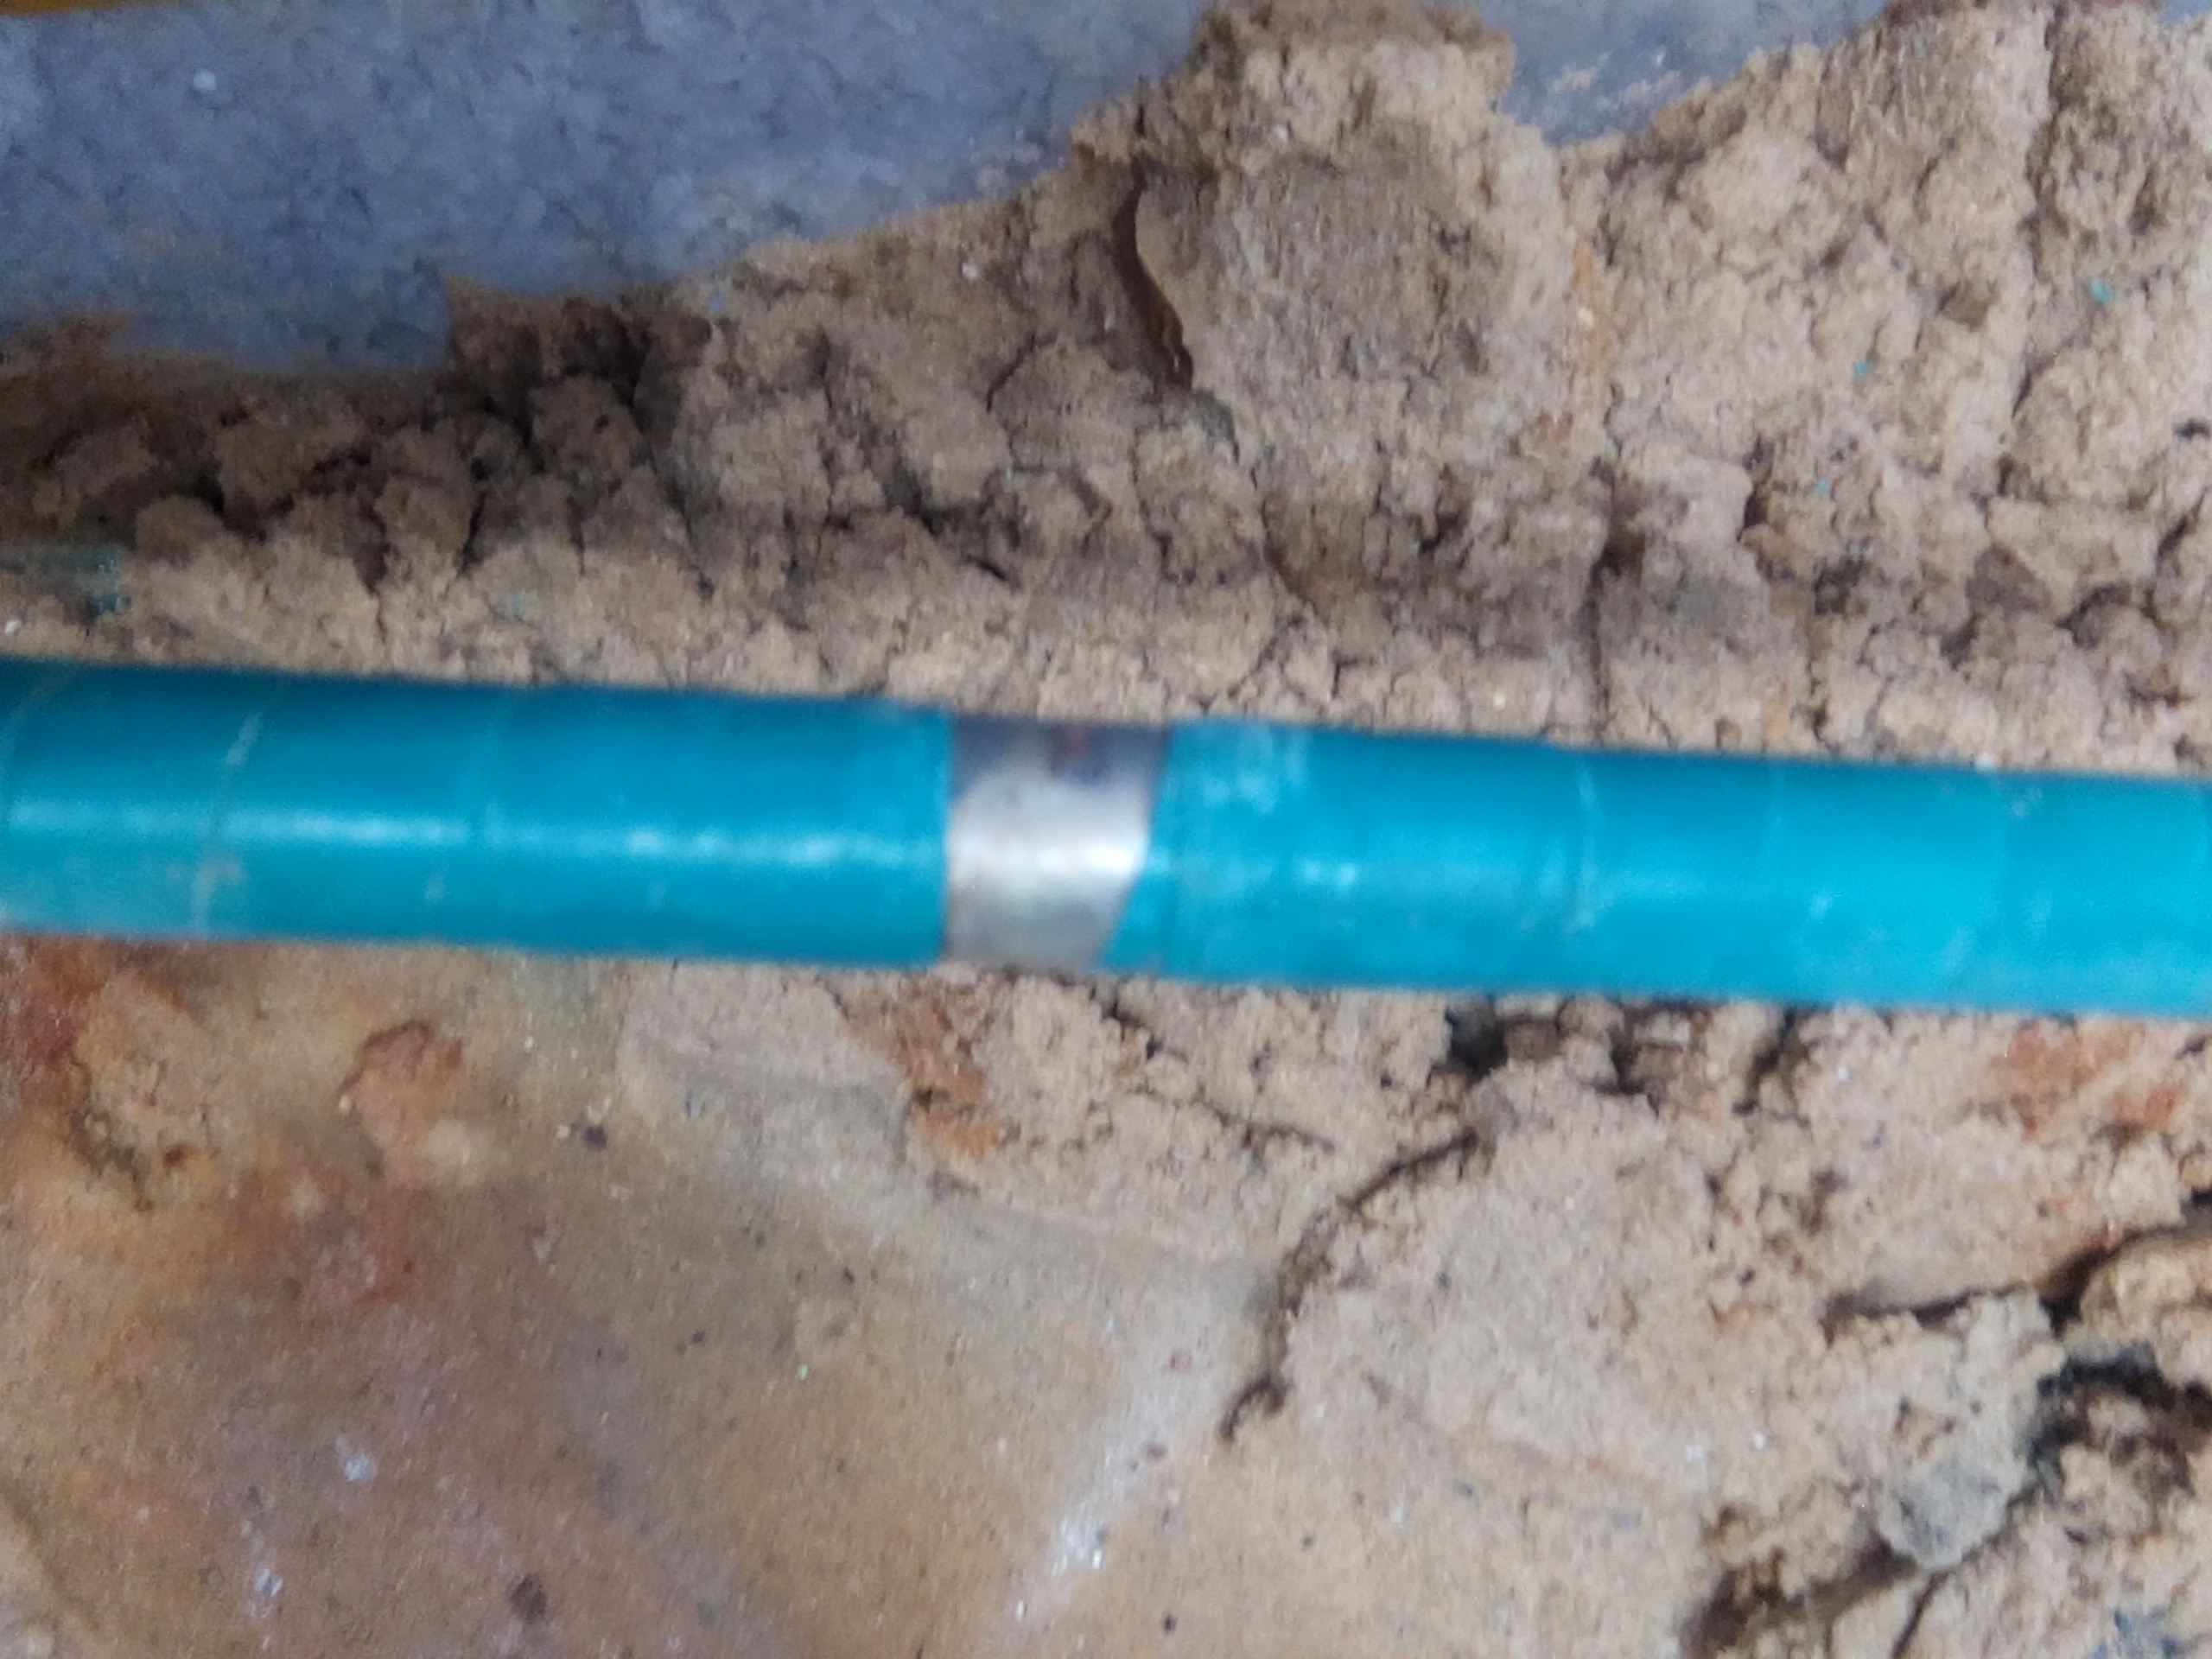
The green taped pipe uncovered.
104.
The green taped pipe uncovered.
105.
The green taped pipe raised for inspection.
106.
The green taped pipe raised for inspection close..
107.
The green taped pipe raised for inspection close view of bare metal.
108.
The green taped pipe raised for inspection close view.
109.
The green taped pipe.
110.
The anode
111.
The anode
112.
The anode
113.
The anode
114.
The cloth is folded back
115.
The cloth is folded back
116.
The crocodile clipp was disolved
117.
This picture is evidence.
118.
This picture is evidence.
118.
This picture is evidence.
119.
This picture is evidence.
120.
This picture is evidence.
121.
This picture is evidence.
122.
This picture is evidence.
123.
This picture is evidence.
124.
This picture is evidence.
125.
This picture is evidence.
126.
This picture is evidence.
127.
This picture is evidence.
128.
This picture is evidence.
129.
This picture is evidence.
130.
This picture is evidence.
131.
This picture is evidence.
132.
This picture is evidence.
133.
This picture is evidence.
134.
This picture is evidence.
135.
This picture is evidence.
136.
This picture is evidence.
137.
This picture is evidence.
138.
This picture is evidence.
139.
This picture is evidence.
140.
This picture is evidence.
141.
This picture is evidence.
142.
This picture is evidence.
143.
This picture is evidence.
144.
This picture is evidence.
145.
This picture is evidence.
146.
This picture is evidence.
147.
This picture is evidence.
148.
This picture is evidence.
149.
This picture is evidence.
149.
This picture is evidence.
Stage 3
Time.
Time
150.
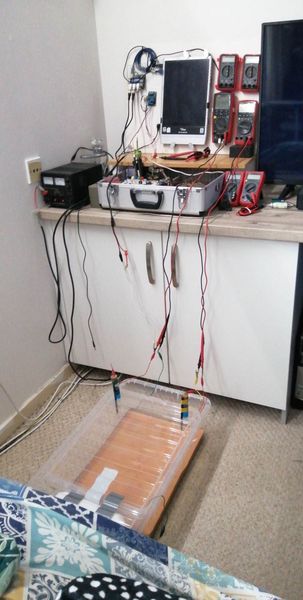
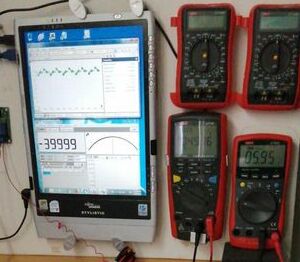
Oscilloscope with connecting leads dangling, picking up free energy.
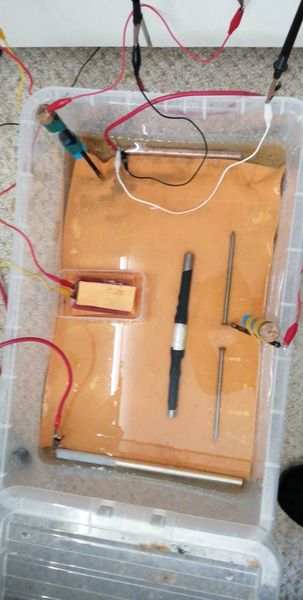
150.
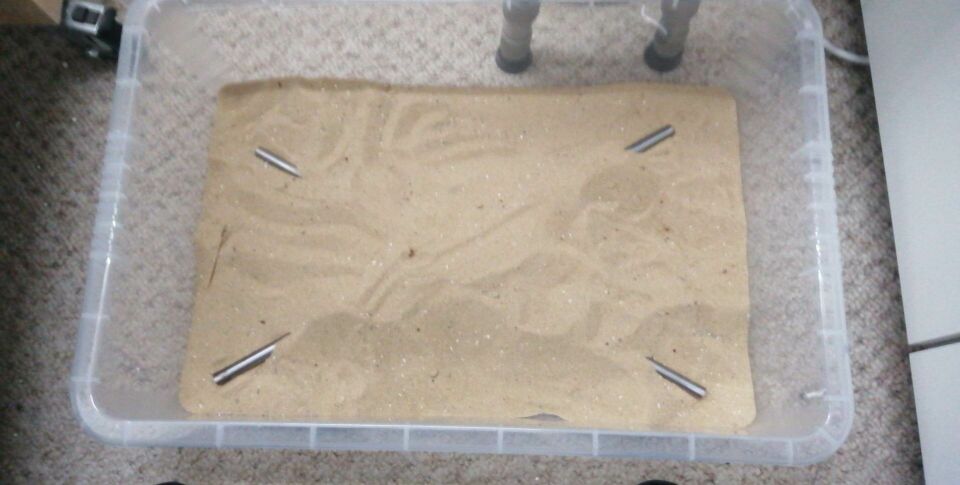
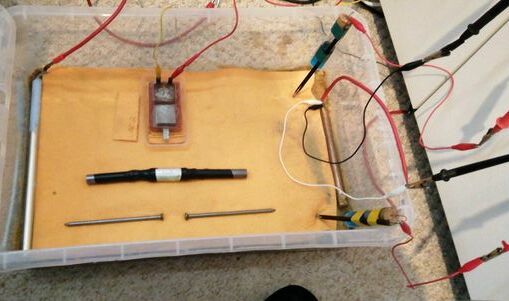
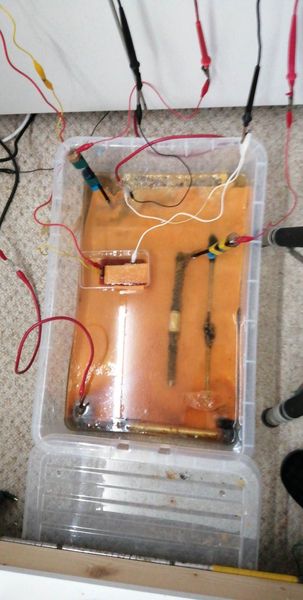
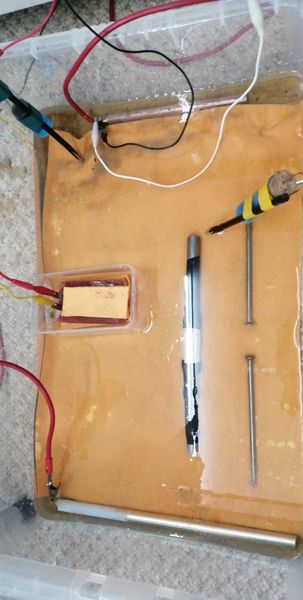
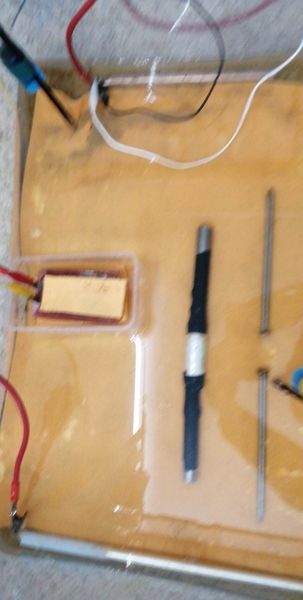
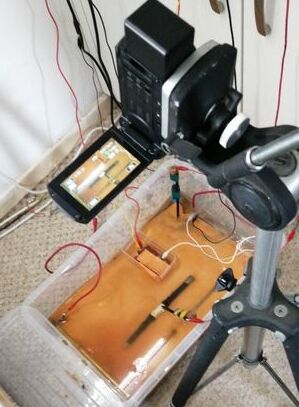
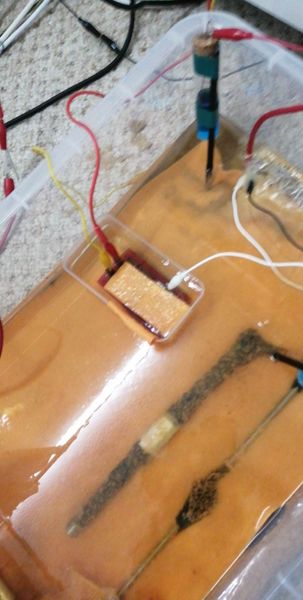
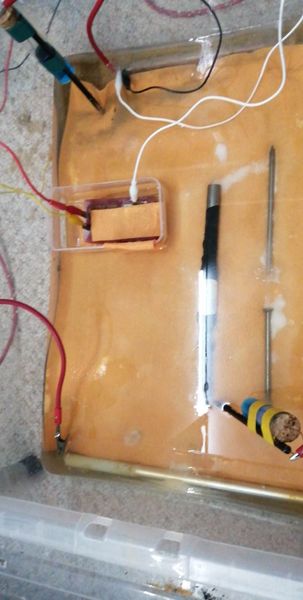
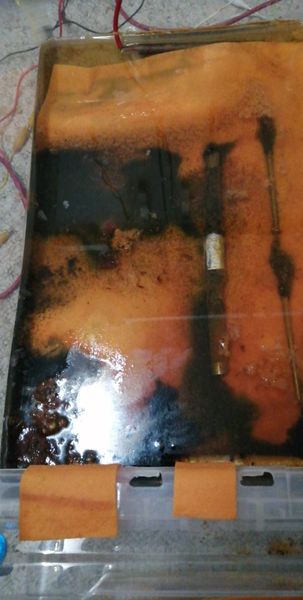
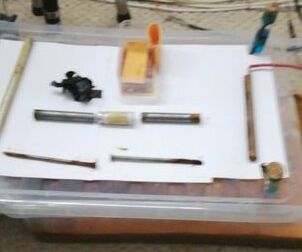
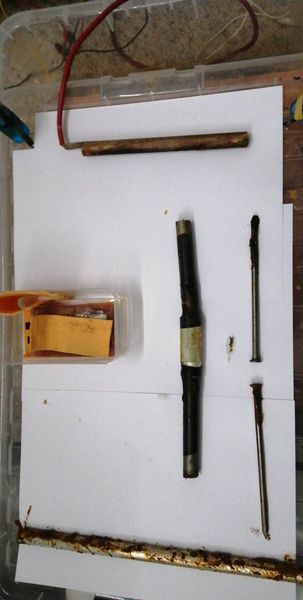
The clear plastic container is set up as shown below.
A steel alloy pipe is used as an anode.
The Alexander Cell is top center.
A CPN half-cell is top right
The test pipe is in the center
Two steel nails are parallel to the test pipe.
A CPN half-cell is in the bottom right corner.
151.
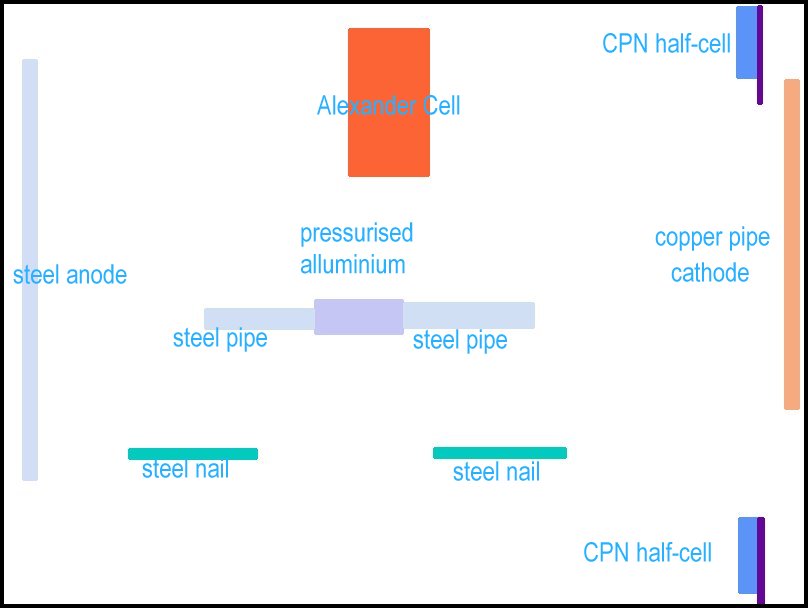
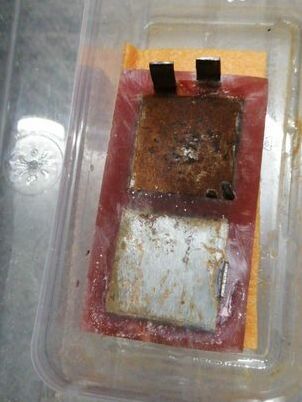
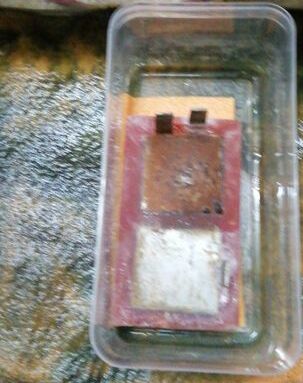
The Alexander Cell is a corrosion cell in which the corrosion current can be measured while the corrosion is under the influence of cathodic protection.
152.
The Alexander Cell is a corrosion cell in which the corrosion current can be measured while the corrosion is under the influence of cathodic protection. The current is measured by the oscilloscope.
TheTR positive is connected to a steel pipe that will corrode. This will also corrode because it will sacrifice to the copper pipe that is under protection.
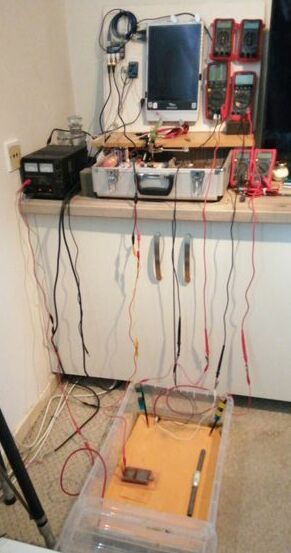
The data logger is recording pipe-to-soil measurments between the protected pipe and the roving CPN half-cell.
The volt meter is recording pipe to soil measurements between the protected pipe and the static CPN half-cell, to which all voltages are referred.
153.
Technotoy is an electronic cathodic protection system simulator that can make all the required measurements for computer analysis of cathodic protection.
154.

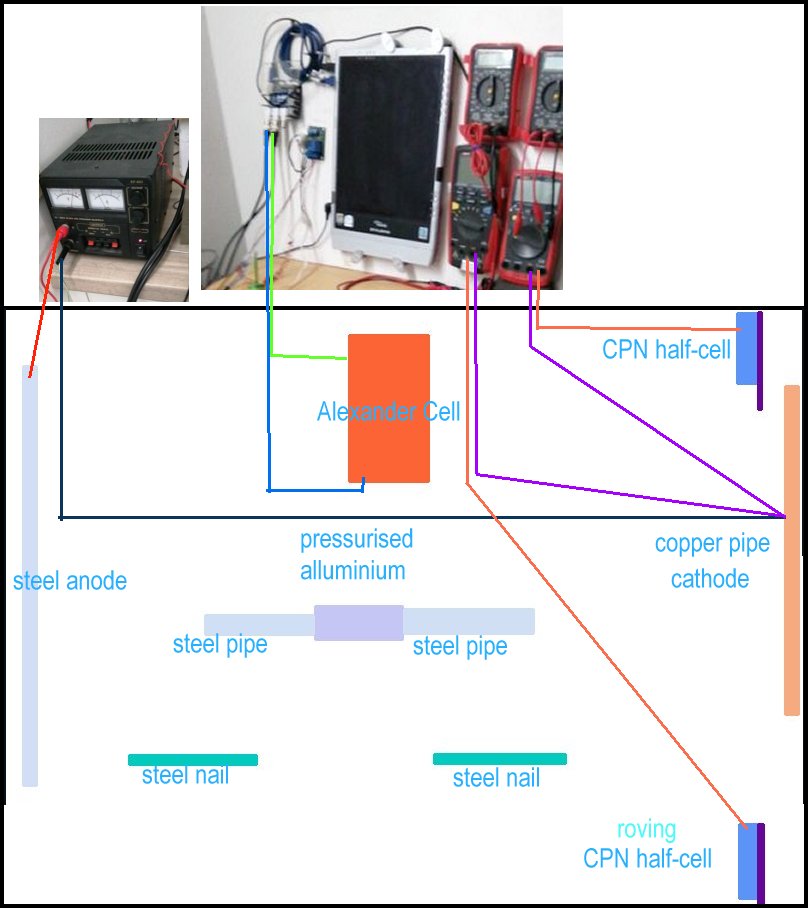
Connection schematic
155.
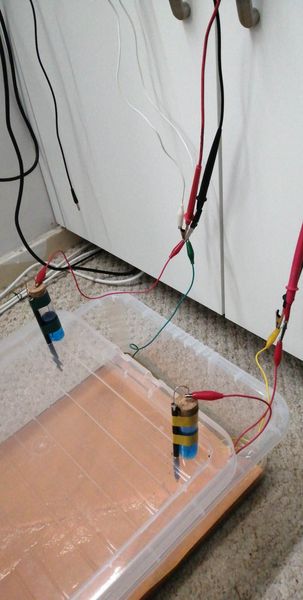
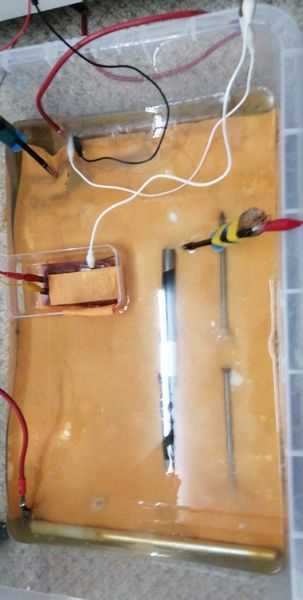
This picture shows the set up with the dry super-absorbant cloth over the bed of sand.
The Alexander Cell current is measured by the oscilloscope through red and yellow leads. The Alexander Cell is not connected to the cathodic protection system at this stage so shows the effects of stray current.
TheTR positive is connected to a steel pipe with a red lead. DC energy is impressed into the salt water in the container and returns to the TR via the copper pipe that is protected also by the galvanic reaction between steel and copper.
The data logger is recording pipe-to-soil measurments between the protected pipe and the roving CPN half-cell seen in the bottom right corner.
The volt meter is recording pipe to soil measurements between the protected pipe and the static CPN half-cell, to which all voltages are referred. This is seen in the top right corner.
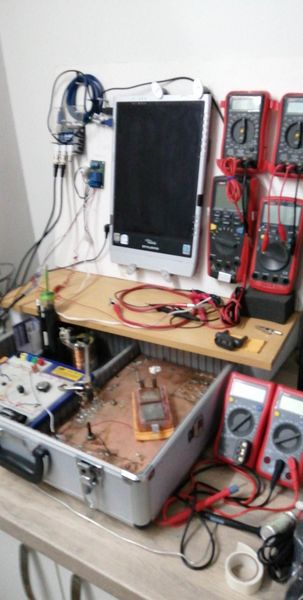
156.
This picture is a photograph of the set up connections to confirm the drawings and pictures above.
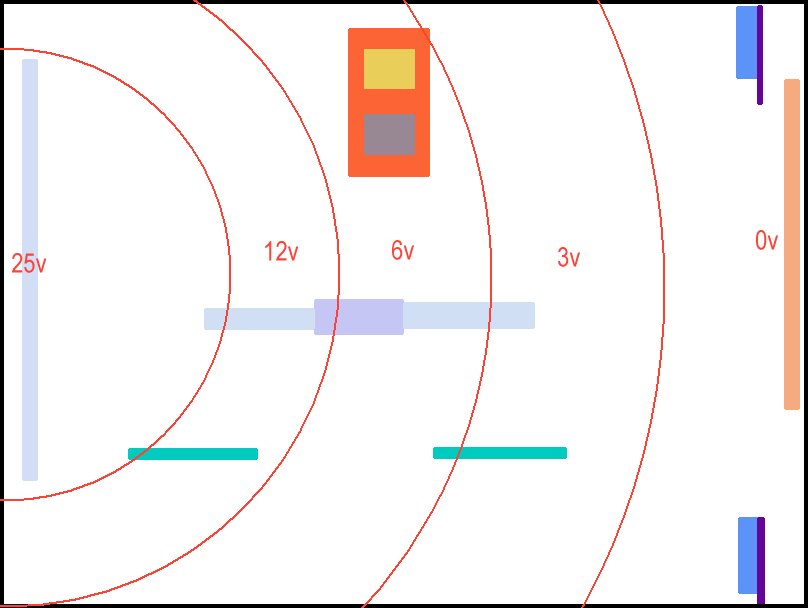
157.
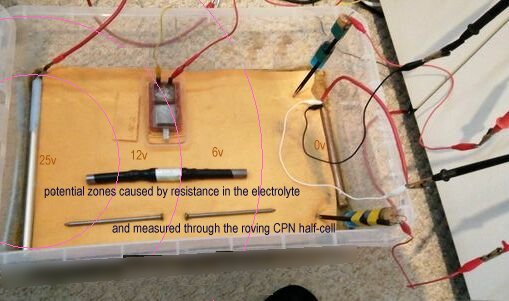
This picture shows the anticipated potential zones caused by the passage of electrical energy through the circuit and subject to Ohms Law and Kirchhoffs Laws.
TheTR pumps electrical energy into the steel pipe, raising the potential to 25 volts with respect to the copper pipe that is connected to the negative connection of the TR.
The roving CPN half-cell seen in the bottom right corner is in a potential zone close to the protected pipe and is related to the reference CPN electrode in the top right hand corner. The voltage in this position will be very low.
.
The volt meter is recording pipe to soil measurements between the protected pipe and the static CPN half-cell, to which all voltages are referred. This is seen in the top right corner.
158. TR.
TR is OFF
159.
This picture is early in the timeline as the corrosion is little but the ALCE is connected and the salt bridge in place so the oscilloscope will be flatline and the roving half-cell probe is in the mid range position of around 6 volts. We can know this from the information in this picture but when Technotoy is connected and functioning we will have a record of the time and the exact data that will tell us how much metal has been dissolved at this time.
160.

Time
162.
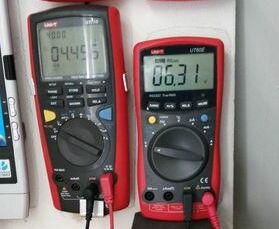
0.4442 v reference pipe to soil 1.416 roving pipe to soil. The protected copper pipe is zero in this circuit so the roving half-cell must be close to the copper pipe.
163.
Oscilloscope flattish line, impressed current suppressing corrosion noise. The TR must be on and the Alexander Cell connected and activated.
164.
Roving half-cell close to cathode but the Alexander Cell not connected to the CP therefore the oscilloscope will show corrosion noise.
165.
Water in ALCE not connected to impressed current system.but activated and isolated.
166.
ALCE connected plus salt bridge roving half-cell close to cathodic protection system anode. The roving half-cell voltmeter will display 8 or 9 volts and the oscilloscope will be flatline.
167.
Water in ALCE isolated, half-cells in corners no corrosion.
168.
TR 25v 0.6 amps
169.

0.4934 v reference pipe to soil 0.964v roving pipe to soil.
170.
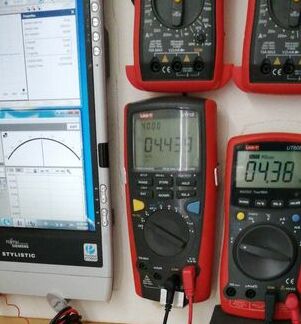
Technotoy, oscilloscope flatter, 0.6132 v ref -157.6mv roving
171.
Roving half-cell corrosion end of pressure pipe, nails corroding, ALCE connected.
173.
Roving half-cell corroding end of left nail, little corrosion.
174.
This picture is TR
175.
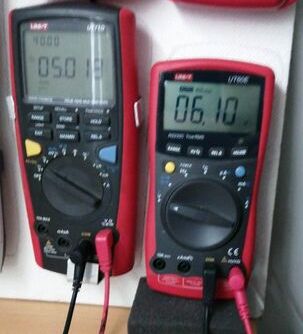
0.5013 v reference pipe to soil, 06.10v roving half-cell
176.
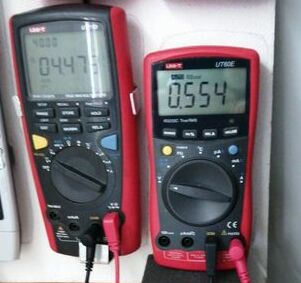
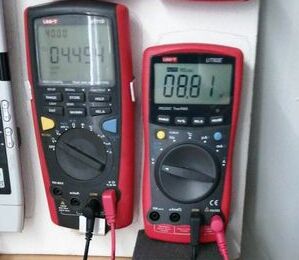
0.4475 v reference pipe to soil, 0.554 v roving half-cell.
177.
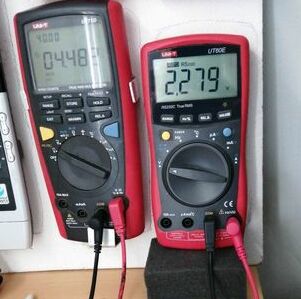
0.4482 reference pipe to soil, 2.279 roving half-cell
178.
roving half-cell close left end of right nail.no corrosion.
179.

0.5026 v reference pipe to soil 04.66 v roving half cell.
158.
This picture is the TR.
180.
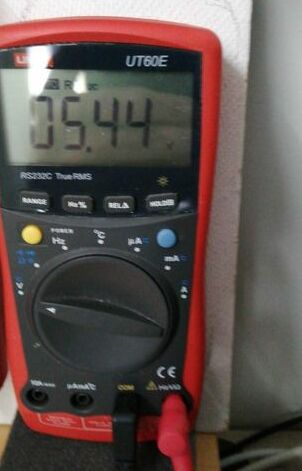
This picture is roving half-cell voltmeter 05.44 volts so the probe must bein the central potential zone.
181.
This picture is
182.
This picture is
183.
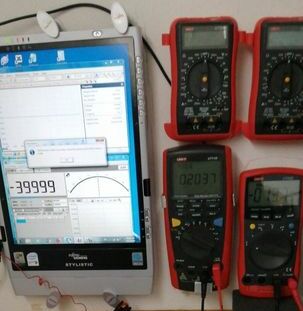
The reference potential is 0.4482 and the roving half-cell is 09.83 volts indicating that the probe is close to the ICCP system anode at the left of the container.
184.
This picture is
185.
This picture is blurred but still of use in that it shows the roving half-cell probe to be at the right hand end of the left hand nail. The current from the ICCP anode is going into the nail that is at a lower potential than the electrolyte at this point, and passing out of the nail at the right hand end dissolving metal and over time leaving a stain on the cloth. The Alexander Cell is not connected to the ICCP system and the oscilloscope will be showing corrosion noise because the base electrodes of the ALCE are wet.
186.

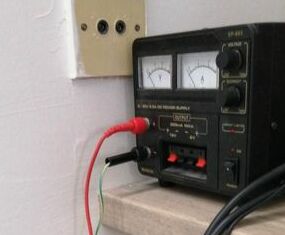
This picture is the electrical energy supply set at 25 volts resulting in 0.25 amps
187.
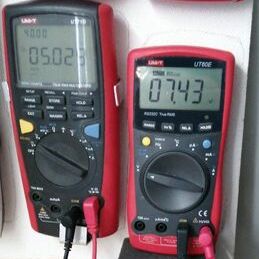
0.5023 volts ref potential 07.43 roving half cell. The system has been active for some time and the roving probe is about 1/3 distant from the ICCP anode.
188.
This is corrosion noise from the Alexander Cell that is connected to the oscilloscope and not to the ICCP system.
189.
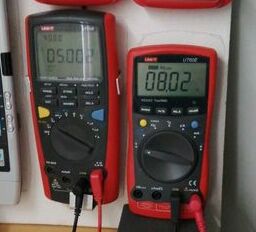
0.5002 reference potential and 08.02 volts on the roving half-cell probe indicating that the point of contact is about 20% distance fromthe ICCP anode.
190.
This picture shows the latest time and must be at the end of this stage of the experiment.
191.
The oscilloscope is showing corrosion noise. This is from the Alexander Cell that cannot be connected to the protected pipe.
192.
The roving half-cell probe is close to the left hand end of the left hand nailthat is in the 9 volt potential zone of the electrolyte. The nail will depress the potential at this point in a similar way to that detected in a DCVG survey. The Alexander cell has not been connected to the protected pipe and there is no salt bridge so the oscilloscope will show corrosion noise.
193.
The ALCE is activated with salt bridge and connected to the ICCP system so the oscilloscope will be flat lined. There is little visible corrosion product and the roving half-cell is close to the protected pipe so the reading on the left hand voltmeter will be low and similar to the reference potential.
194.
This is technotoy telling us that there is corrosion noise from the ALCE and the roving half-cell is in the 5.95 potential zone.
195.
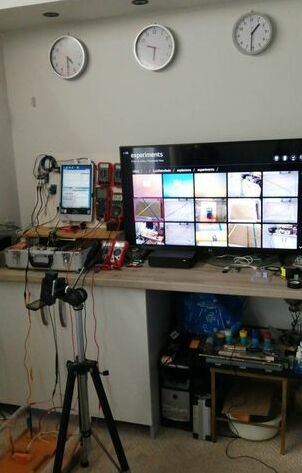
This picture relates the set up to the start of the video filming. See Youtube and web page.
196.
This picture is
198.

This is the voltage between the roving half-cell and the protected pipe.
199.
This picture is Technotoy
200.
This picture is
201.
This picture is
202.
This picture is
203.

This picture is
204.
This picture is
205.

This picture is
207.
This picture is
208.
This picture is
209.
This picture is
210.
This picture is
211.
This picture is
212.
This picture is
213.

This picture is
214.
This picture is
215.

This picture is
216.
This picture is
217.
This picture is
218.
This picture is
219.
This picture is
220.

This picture is
221.
This picture is
222.
This picture is
223.
This picture is
---------------------------------------------------------------------------------------------------------
-
-----------------------------------------------------------------------------------------------------------
224.
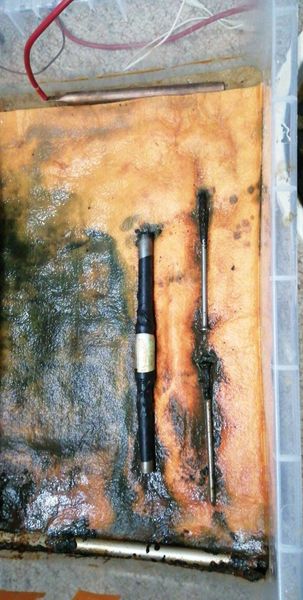
After the water has been mopped away after the experiment has been de-activated.
225.
When the energy has been turned off before the water has been drained.
226.
This picture is the Alexander Cell
227.
This picture is the Alexander Cell
228.
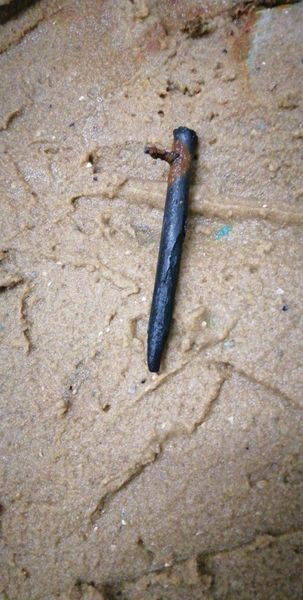
This picture is the impressed current anode accelerated corrosion. Left nail point protected and bright. Left end of left test pipe brignt and protected by stray current entering metal.
229.
Container drained, right nail head protected, point corroded by stray current.
230.
This picture is
231.
This picture is
232.
This picture is
233.
This picture is
234.
This picture is
235.
This picture is
236.
This picture is
237.

This picture is
238.
This picture is
239.
This picture is
240.
This picture is
241.
This picture is
242.
This picture is
243.
This picture is
244.
This picture is
245.
This picture is
246.
This picture is
247.
This picture is
248.

This picture is
